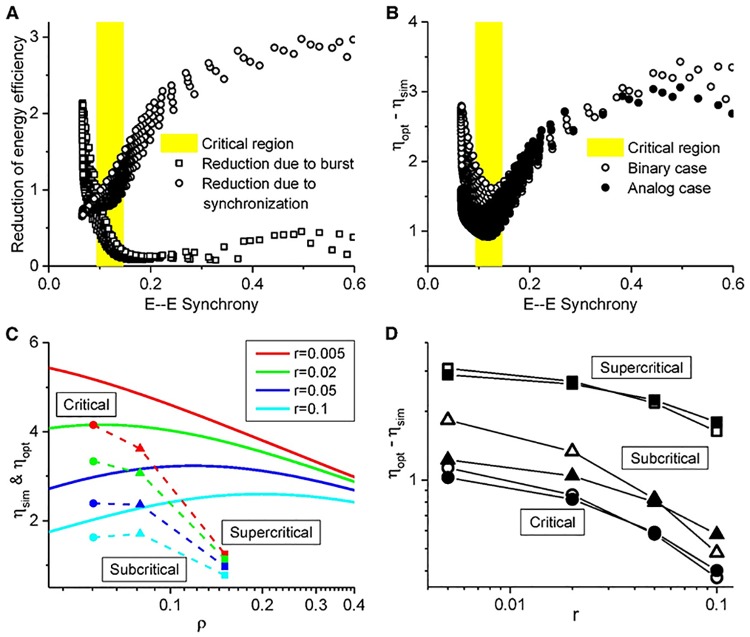
Fig 8. Trade-off in energy efficiency reduction.
(A) Energy efficiency reduction by burst and synchronization in binary scenario; (B) Energy efficiency reduction is minimal in the critical region in both binary and analog scenarios; r = 0 for (A, B). (C) Comparison of simulated energy efficiency ηsim with the upper bound ηopt at various states for various r. The optimum is represented by solid lines and the simulated by symbols. (D) ηopt − ηsim vs. r in both binary (open circles) and analog (solid points) scenarios. Energy efficiency reduction keeps minimal in the critical region at various r in both scenarios. (C, D) Parameters (τd_e, τd_i) are indicated in Fig 6A and 6B with corresponding symbols; n = 40 for all patterns.

