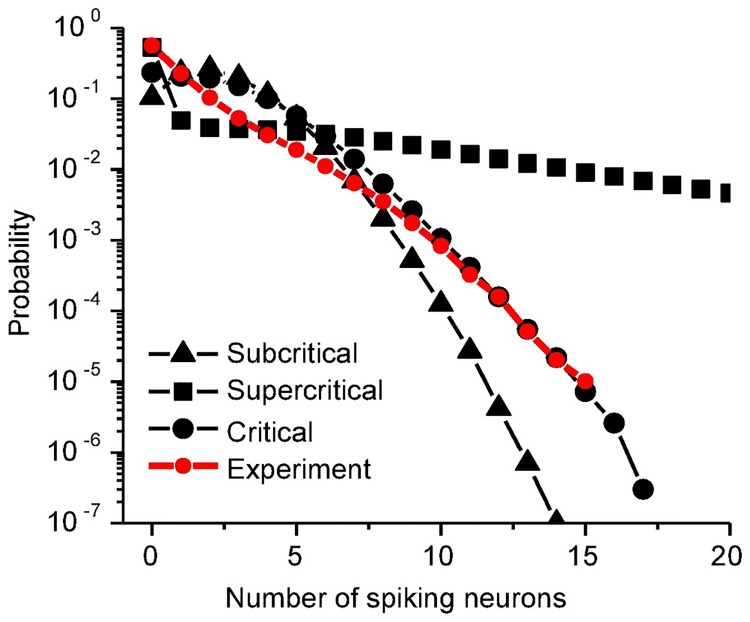
Fig 9. Spiking neuron number distribution.
Probability distributions of the activated neuron number for the selected states, indicated in Fig 6A and 6B with the corresponding symbols. n = 40 for all patterns. The distribution in the critical region is close to the experimental data [48] (red).

