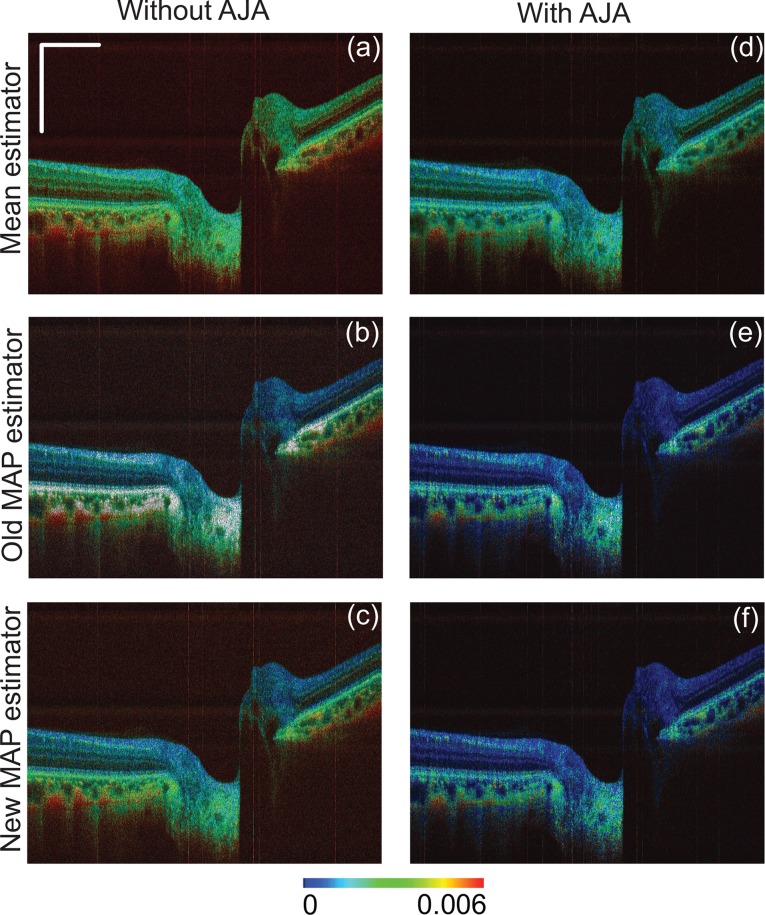
Fig. 3.
Comparison of the mean, old MAP, and new MAP estimators for in vivo posterior eye imaging. The right and left column represent the birefringence estimation without and with adaptive Jones matrix averaging (AJA), respectively. Each row represents the mean, old MAP, and new MAP estimations, from top to bottom.

