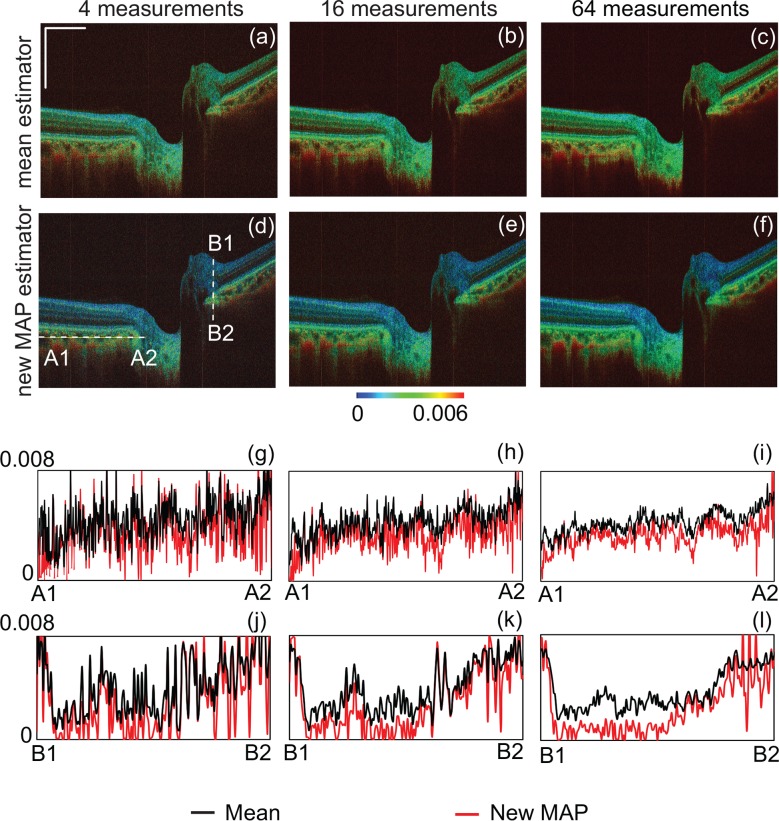
Fig. 5.
Comparison of mean (a)–(c) and new MAP (d)–(f) estimators for 4, 16, and 64 repeated measurements. The first and second rows show pseudo-color birefringence images obtained using the mean and new MAP estimators, respectively. The third and fourth rows show the line profiles of birefringence along A1–A2 (third row) and B1–B2 (fourth row) lines. The black and red curves represent the mean and new MAP estimators, respectively. The positions of the profiles are indicated in (d).

