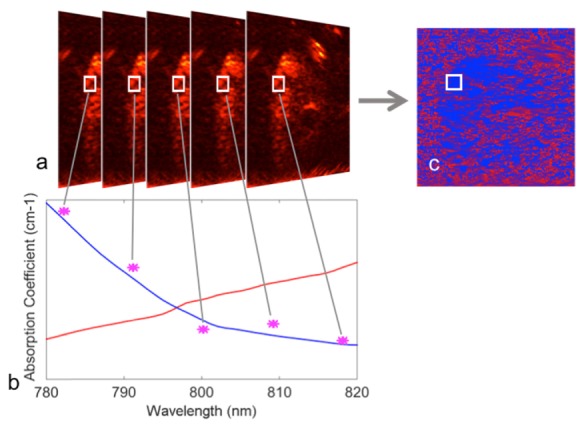
Fig. 1.

Linear least squares fitting of 2D images of photoacoustic signal intensity variation with laser wavelength to the optical absorption of oxy- and deoxyhemoglobin, to generate 2D images of sO2. (a) photoacoustic images acquired at multiple laser wavelengths; (b) photoacoustic signal at each pixel is fit to the optical absorption coefficient of oxy- and deoxyhemoglobin to generate a 2D map of sO2 (c).
