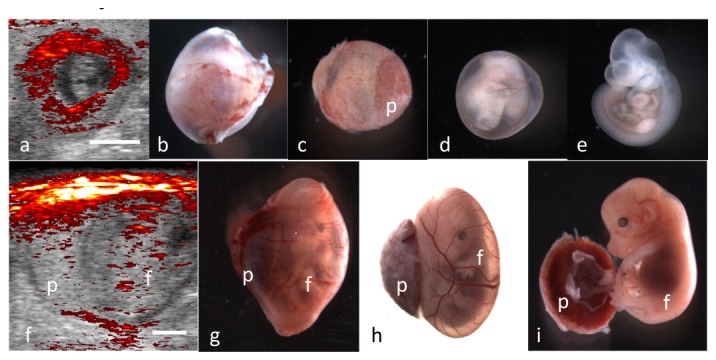
Fig. 3.

Endogenous photoacoustic contrast in E10.5 and E14.5 concepti. (a) ultrasound-guided photoacoustic image, (b) excised gravid uterine horn segment, (c) Reichart’s membrane (d) yolk sac; and (e) embryo of E10.5 conceptus. (f) ultrasound-guided photoacoustic image, (g) excised gravid uterine horn segment, (h) yolk sac and (i) fetus of E14.5 conceptus. Scale bars = 2mm. placenta (p) and fetus (f) are labeled in the images.
