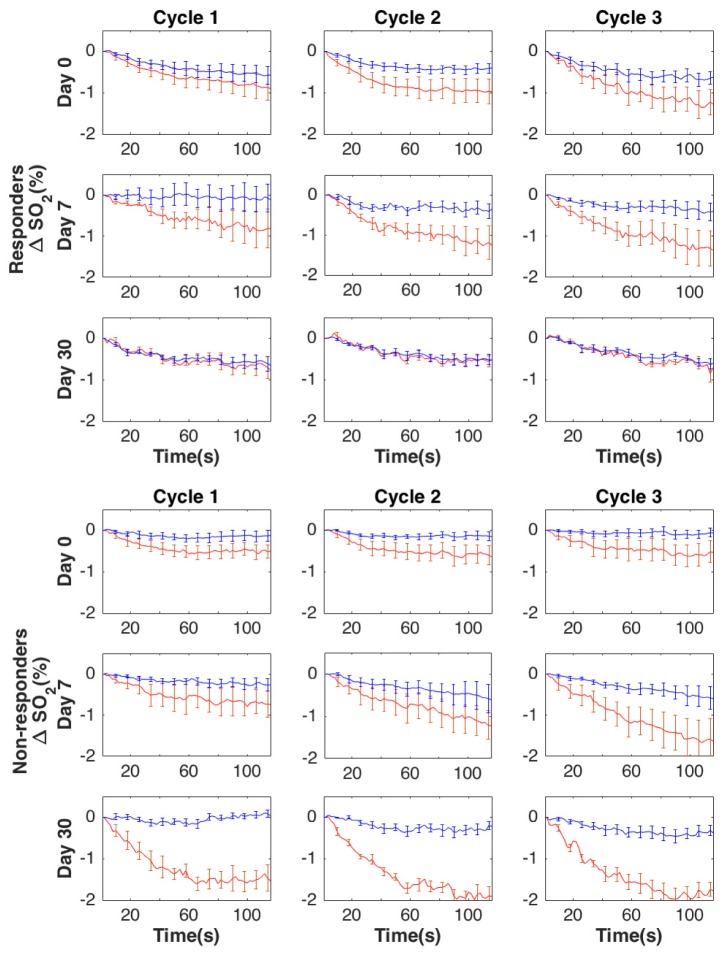
Fig. 4.
Group averaged compression induced changes in ΔSO2 (μM) for responders and non-responders, respectively, within the tumor (red lines) and normal (blue lines) regions of the breast due to compression over the course of NACT (13 subjects for day 0 and day 7, and 7 subjects for day 30). Error bars show standard error.

