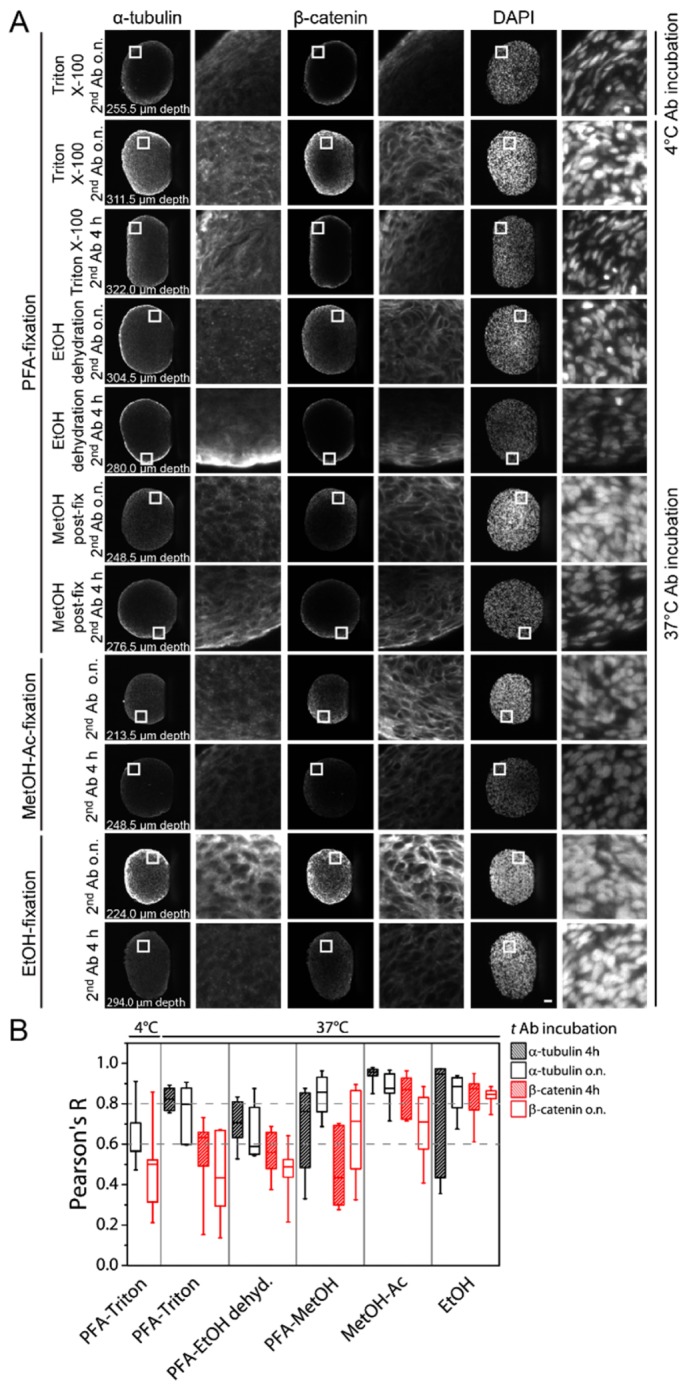
Fig. 6.

(A) Single planes of immunostained U343 spheroids show the dispersion of the antibody as well as the quality of the stain. Slides were taken from the middle region of the spheroids. The z-depth is indicated for each condition. White squares indicate the magnified areas (8x) in each spheroid. Microscope: mDSLM; illumination objective: Epiplan-Neofluar 2.5x/NA 0.06; detection objective: N-Achroplan 10x/NA 0.3; α-tubulin: 561 nm, 0.09 mW, bandpass filter 607/70; β-catenin: 488 nm, 0.134 mW, bandpass filter 525/50; DAPI: 405 nm, 0.01 mW, bandpass filter 447/55; scale bar: 50 µm. (B) The influence of the fixation/permeabilization and the incubation time of the secondary antibodies is expressed as Pearson’s R. It describes the degree of similarity to the DAPI intensity profile, which represents a homogeneous dispersion of a fluorophore within a spheroid. The box-plot shows the median line and the 25 and 75 percentiles. The whiskers represent the min and max values. Ab: antibody; Ac: acetone, dehyd.: dehydration, EtOH: ethanol, h: hours, MetOH: methanol, o.n.: overnight; h: hours.
