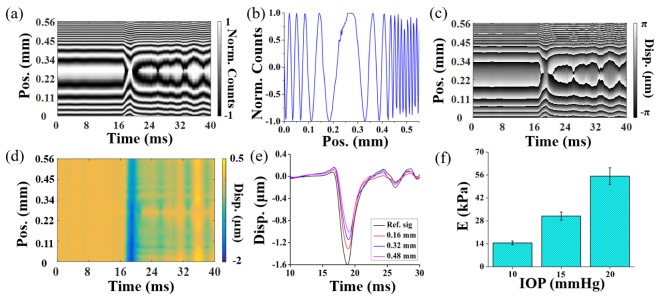
Fig. 5.
(a) Spatio-temporal map of the contrast-enhanced interference pattern from an in situ porcine cornea in the whole eye-globe configuration at an artificially controlled IOP of 10 mmHg. (b) The corresponding intensity distribution at 8 ms. Examples of (c) the phase map and (d) spatio-displacement profile. (e) Typical displacement profiles during elastic wave propagation. (f) Reconstructed Young’s moduli of cornea at different IOP. The error bar represents two standard deviations.

