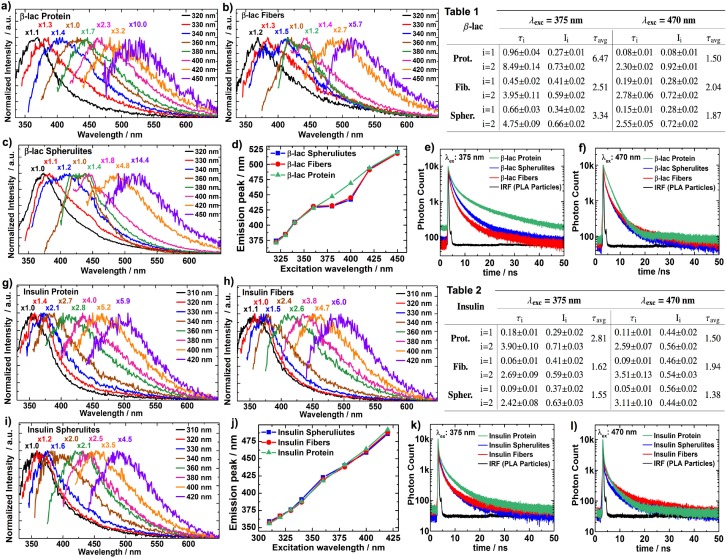
Fig. 2.
Intrinsic fluorescence. The data for the intrinsic fluorescence from the β-LG from bovine milk (a–f) and bovine insulin (g–l), at ∼5 mg/mL in 25 mM HCl water solutions. Fluorescence emission spectra are shown for the native proteins (a, g), the amyloid fibers (b, h), and the amyloid spherulites (c, i), when λexc ranges from 310 to 450 nm. The emission peaks are plotted versus the λexc for both β-LG (d) and insulin (j) for the respective types of samples: native proteins (green, ▵), amyloid fibers (red, ○), and amyloid spherulites (blue, □). The fluorescence decays for λexc at 375 nm (e, k) and 470 nm (f, l) are presented for the native proteins (green), the amyloid spherulites (blue), and the amyloid fibers (red) – as well as the instrument response function (black) measured with 250 nm poly-L-lactic acid particles. The lifetimes (ns) and fractional intensities for double-exponential fits of the decays are shown for both the β-LG (Table 1) and insulin (Table 2) samples with λexc at 375 nm and 470 nm. The 95 % confidence intervals for the fitted parameters are included.

