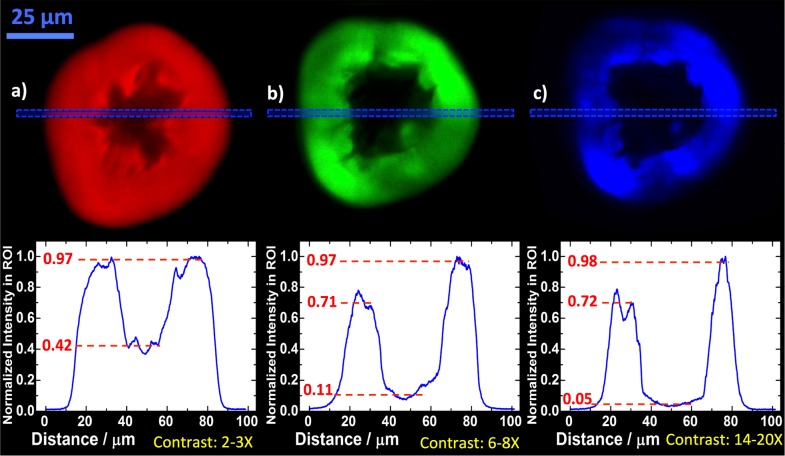
Fig. 4.
Contrast between the amorphous core and fibrillar region. For the bovine insulin spherulites, the relative intensities for the core and the fibrillar regions were evaluated by taking regions of interest (dashed blue boxes) linescans for the confocal fluorescence (a - red), MPEF (b - green) and SHG (c - blue). The scale bar is 25 μm for all spherulites and the λexc were 405 nm (a) and 910 nm (b, c), respectively.

