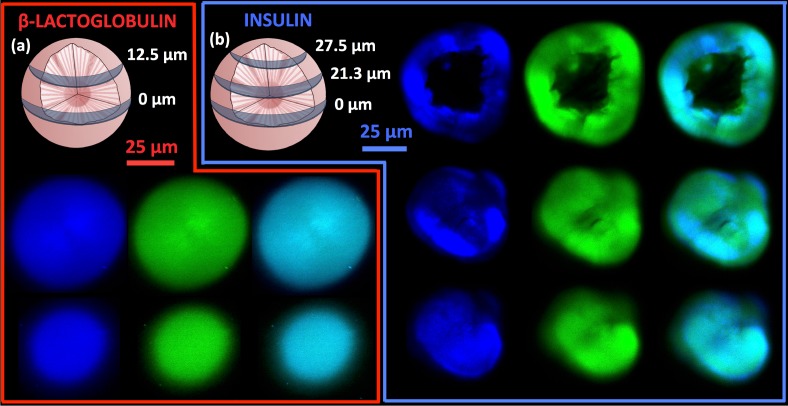
Fig. 5.
Various cross-sections for the spherulites. Cross-sections of a spherulite from β-LG from bovine milk (a) at 0 μm (top row) and 12.5 μm (bottom row) from the center with SHG (blue/left), MPEF (green/middle), and overlays (right); the scale bar is 25 μm. Cross-sections of a spherulite from bovine insulin (b) at 0 μm (top row), 21.3 μm (middle row), and 27.5 μm (bottom row) from the center with SHG (blue/left), MPEF (green/middle), and overlays (right); the scale bar is 25 μm. λexc was 910 nm in all cases. 3D-animations created from a z-stack of a 37 μm insulin spherulite are provided in the supplementary material. Both half the spherulite imaged with SHG ( Visualization 1 (557.7KB, MOV) ) and MPEF ( Visualization 3 (356.7KB, MOV) ), as well as the entire spherulite imaged with SHG ( Visualization 2 (274.3KB, MOV) ) and MPEF ( Visualization 4 (270.8KB, MOV) ) are shown.

