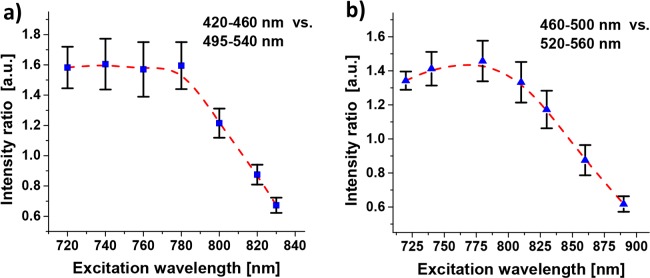
Fig. 7.
Excitation wavelength dependence in MPEF images. Ratio of average intensities for the insulin spherulites in the two detector channels. The bandpass filters windows compared are (a) 420–460 nm vs. 495–540 nm and (b) 460–500 nm vs. 520–560 nm. The error bars are St. Dev. from measurements on four spherulites and the excitation laser power was 80–400 mW, depending on the wavelength. The dashed red lines are splines intended as visual guide.

