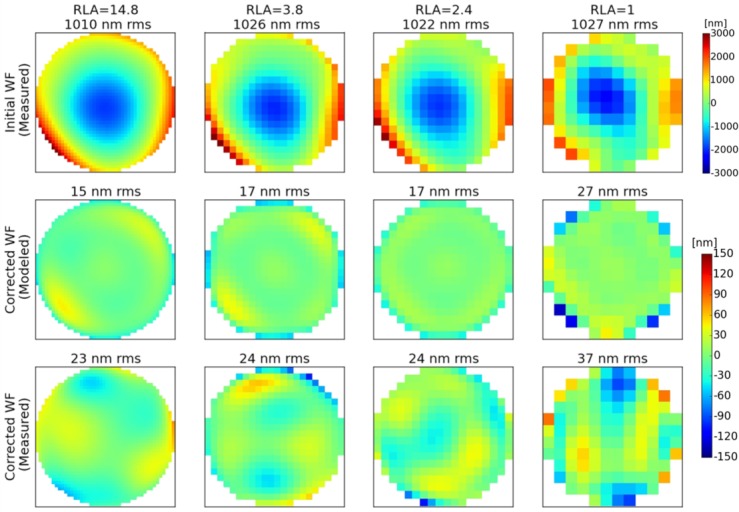
Fig. 8.

WF measurements and corresponding residual WFs after AO-correction of the left eye of V2 for different RLA configurations. 1st row: WFs measured before correction. 2nd row: Simulated residual WFs after correction of the measured WF. 3rd row: Measured residual WFs, after AO-correction with the instrument.
