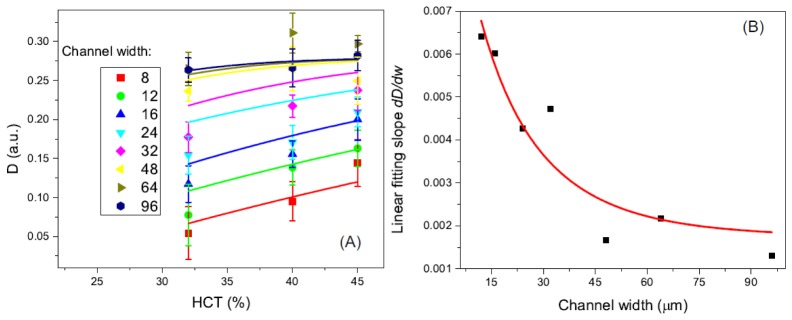
Fig. 5.
(A) Decorrelation value as a function of the HCT for all the channel widths ranging from 8 μm to 96 μm. Solid lines are theoretical model fitting results for different channel width. (B) Linear fitting slope value of the experimental data as a function of the channel width. Red solid line is the theoretical model (Eq. (16)) fitting result.

