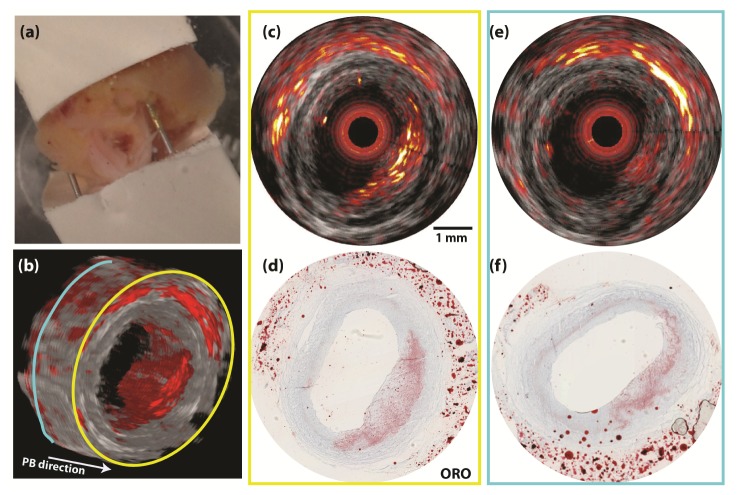
Fig. 2.
IVPA/US cross-sectional image of an atherosclerotic human coronary artery. (a) Photo of the human LAD sample fixed inside a holder. (b) 3D reconstruction of the pullback IVPA/US images. (c) Merged IVPA/US image of the plaque at locations with large plaque volume (the location with a yellow contour) and (e) with small plaque volume (the location with a blue contour). (d) and (f) The ORO histology staining at the imaging plane corresponding to images of (c) and (e). The dynamic range is 35 dB in IVUS image and 20 dB in IVPA image. No averaging was applied to IVUS or IVPA data.

