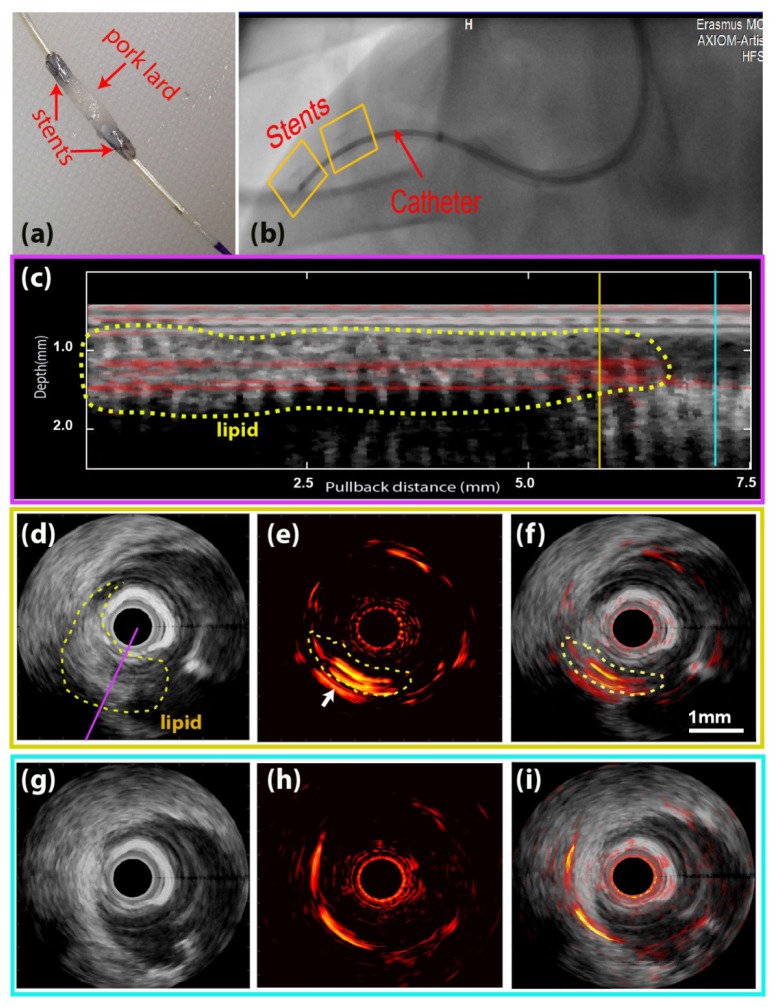
Fig. 3.
In vivo IVPA/US imaging result on a swine model. (a) Stents with lipid target mounted on a balloon catheter. (b) X-ray imaging of the pullback location. The stents were inside the yellow boxes and the lipid target located in between the two stents. (c) Longitudinal view of the pullback merged IVPA/US data at an angle intersecting with the lipid object [indicated with a purple line in (d)]. (d,e,f) Cross-sectional IVUS, IVPA, and merged IVPA/US image at the pullback location indicated with a yellow line in (c). (g,h,i) Cross-sectional IVUS, IVPA and merged IVPA/US image at the pullback location indicated with a blue line in (c).The dynamic range is 32 dB for IVUS images and 18 dB for IVPA images; scale bar in (f) applies to all of (d)-(i). The complete pullback data set is available as Visualization 2 (6.8MB, MP4) .

