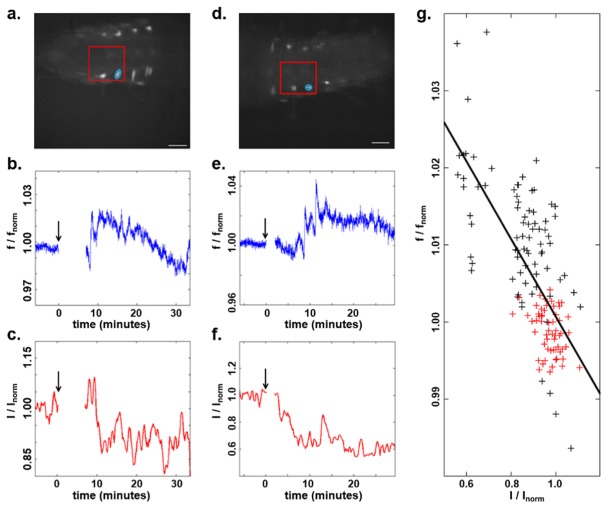
Fig. 4.
(a) Fluorescence image of the Drosophila pre-pupal CNS, with the OCT scanning region marked by the red box and the neuron of interest circled. Scale bar is 100 µm. (b, c) Normalized fluorescence and OCT intensity of the neuron in (a) following exposure of the CNS to 150 nM ETH. The black arrow indicates the starting time of ETH application. (d, e, f) Images and plots from a second experiment following exposure to 600 nM ETH. Gaps correspond to the time required to introduce ETH into the solution and re-focus the imaging system on the sample. (g) Scatterplot of normalized OCT and fluorescence intensities acquired prior to ETH presentation (red) and for 10 minutes following the first fluorescence peak (black) for both experiments.

