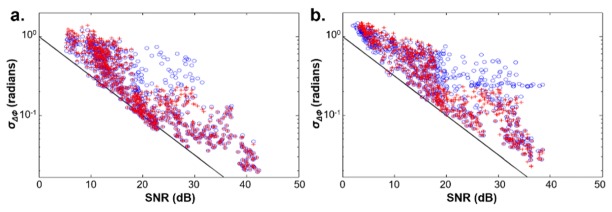
Fig. 5.
Scatterplots of the standard deviation of phase differences acquired from Drosophila CNS versus composite SNR before ETH presentation (left) and during the period of neural activity (right) are shown with blue circles. The standard deviations after removal of phase fluctuations are indicated with red crosses.

