Fig. 4.
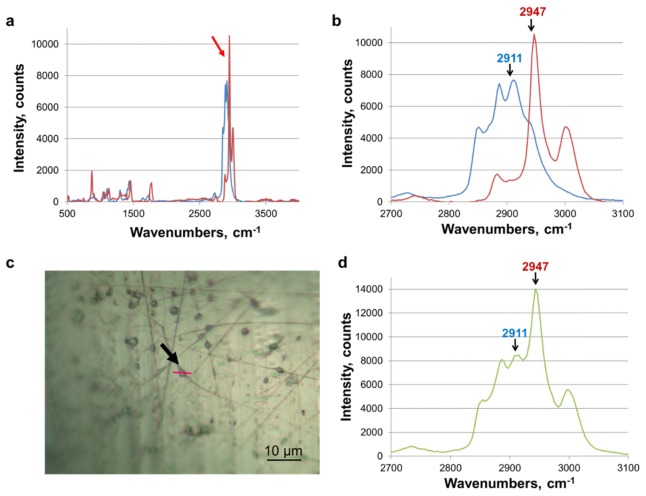
Raman reference spectra: (a) Spectra of PLGA nanofiber and PGS film. Arrow indicates the greatest difference between the polymer spectra. Red and blue spectra are PLGA and PGS, respectively. (b) Zoomed in view of distinct polymer peaks. Chosen peaks for PLGA and PGS were 2947 cm−1 and 2911 cm−1 respectively. (c) 50x optical image of PGS/PLGA nanofibers with bubble in the middle. The red line shows where Raman imaging was performed (indicated with an arrow). Scale, 10µm. (d). Spectra obtained from core/shell PLGA/PGS nanofiber bubble structure, demonstrating that both polymers are present in the “bubble” spectrum, with peaks characteristic of PLGA (blue) and PGS (red) indicated with arrows.

