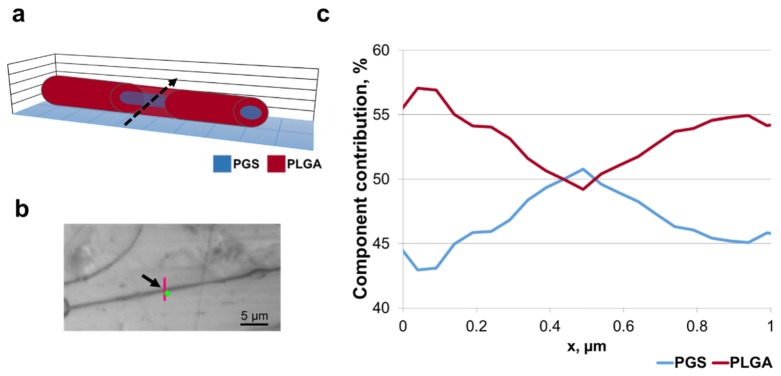
Fig. 6.
Raman spectra from core/shell nanofiber cross section. (a) Schematic of fiber cross-section. Raman mapping was done perpendicular to nanofiber (indicated with a dashed arrow). (b) Optical image showing sample surface mapping recorded perpendicular to fiber (indicated with an arrow). Image taken with 50x objective. Scale, 5µm. (c) Confocal Raman scan across the fiber showing polymer component contribution through a nanofiber (only the part of the scan crossing the fiber is shown; the sum of PLGA and PGS components is normalized to 100%). PLGA (red) and PGS (blue).

