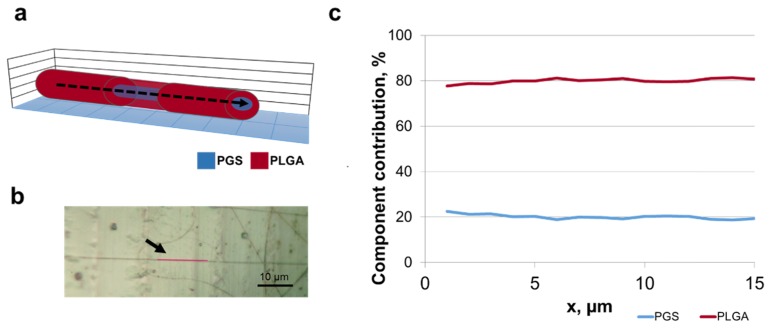
Fig. 7.
Raman spectra from core/shell nanofiber lateral section. (a) Schematic of fiber cross-section. Raman mapping was parallel to nanofiber (indicated with a dashed arrow). (b) Optical image showing sample surface mapping parallel to a fiber (indicated with an arrow). Image taken with 50x objective. Scale, 10 µm. (c) Lateral profile confocal Raman scan showing polymer component contribution through a nanofiber (the sum of PLGA and PGS components is normalized to 100%). PLGA (red) and PGS (blue).

