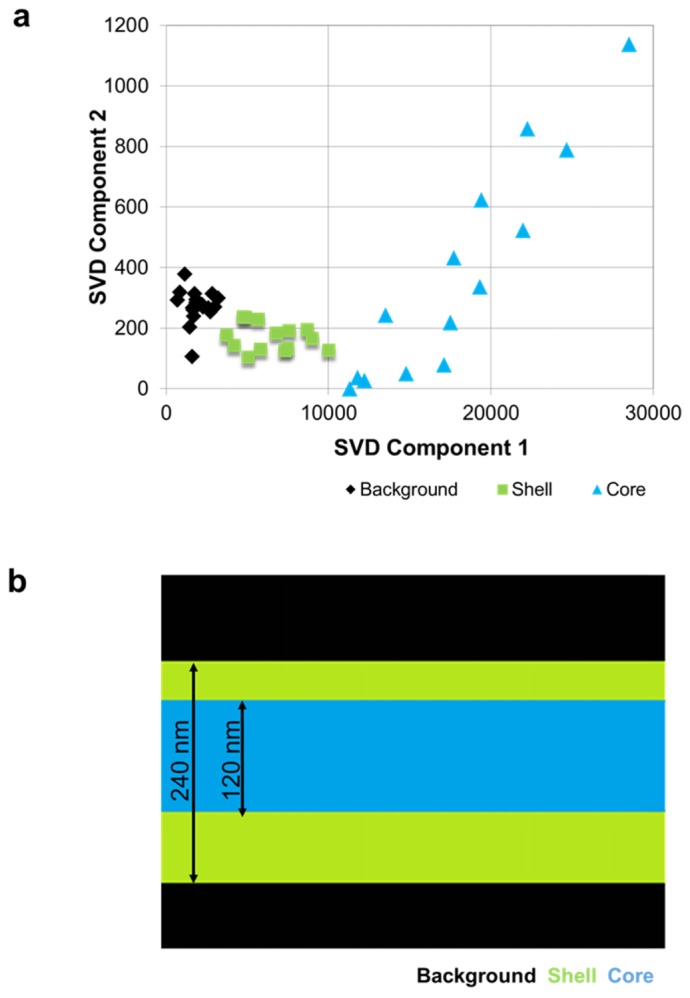
Fig. 8.

Raman spectroscopic imaging of a nanofiber cross-section by Singular Value Decomposition (SVD): (a) SVD scatter plot, showing clear separation of core and shell spectra (b); 1-D hyperspectral Raman image of the structure of the fiber based on the SVD analysis. Blue indicates core material, green indicates shell material, and black indicates no chemical signature of either polymer.
