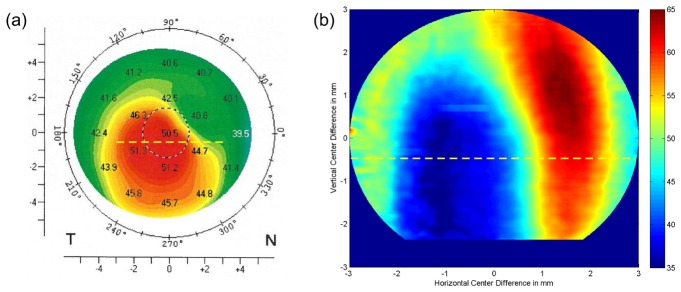
Fig. 11.
Corneal topography of the same 38 year old patient as shown in Fig. 10. (a) Corneal refractive power as measured via Scheimpflug tomography. (b) Epithelial thickness map retrieved from a three-dimensional UHR-OCT data set. Yellow dashed lines in both figures indicate the position of the cross-sectional scan depicted in Fig. 11. Due to reduced signal-to-noise-ratio in the periphery, the evaluated region was cropped to a circular pattern with a diameter of 6 mm. The thinnest region of the cornea is present in the temporal inferior part and corresponds well with the thinnest zone of the epithelium as measured by UHR-OCT.

