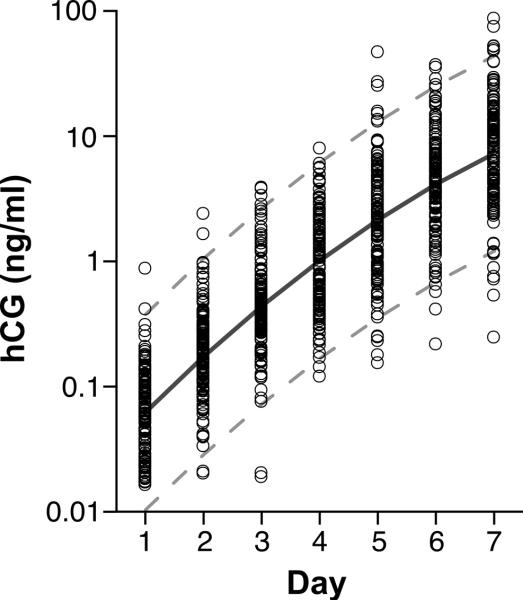
Figure 1.
Predicted hCG excretion pattern and observed values during the first week of detection for 142 clinical pregnancies. Circles represent individual data points, the central solid line represents the hCG trajectory predicted by the regression equation and the broken lines represent the 95% probability band for the model. Day 1 = day of detection (hCG > 0.015 ng/mL).

