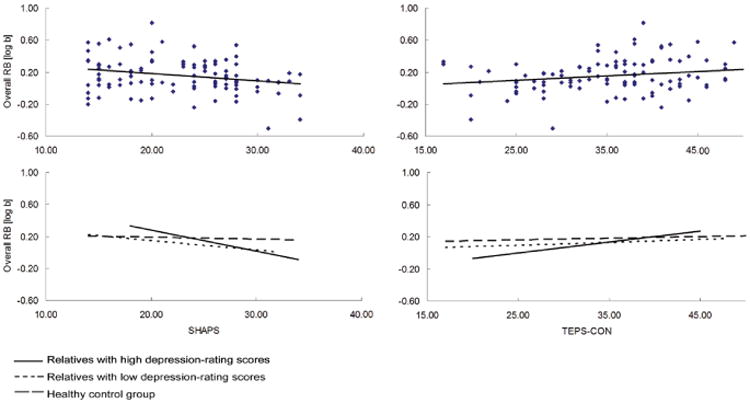
Figure 2.

Top: Scatterplot depicting the relationship between overall response bias (RB) and anhedonia questionnaire measurements in the whole sample. Bottom: Regression lines depicting the relationship separately for the healthy controls, relatives with low depression-rating scores and relatives with high depression-rating scores. Higher anhedonia (SHAPS) and trait consummatory anhedonia (TEPS-CON) were associated with a lower overall response bias in the whole sample and in the relatives with high depression-rating scores (all ps<0.05).
