
Figure 2.
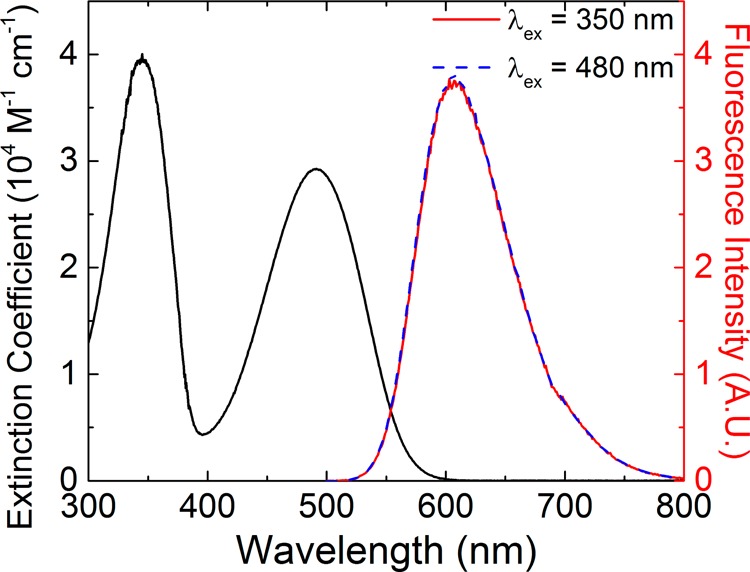
Absorption spectrum (black line) and emission spectra taken at excitation wavelengths of 350 nm (red line) and 480 nm (blue line) of FPPTB in solution (THF).
Official websites use .gov
A
.gov website belongs to an official
government organization in the United States.
Secure .gov websites use HTTPS
A lock (
) or https:// means you've safely
connected to the .gov website. Share sensitive
information only on official, secure websites.
Absorption spectrum (black line) and emission spectra taken at excitation wavelengths of 350 nm (red line) and 480 nm (blue line) of FPPTB in solution (THF).