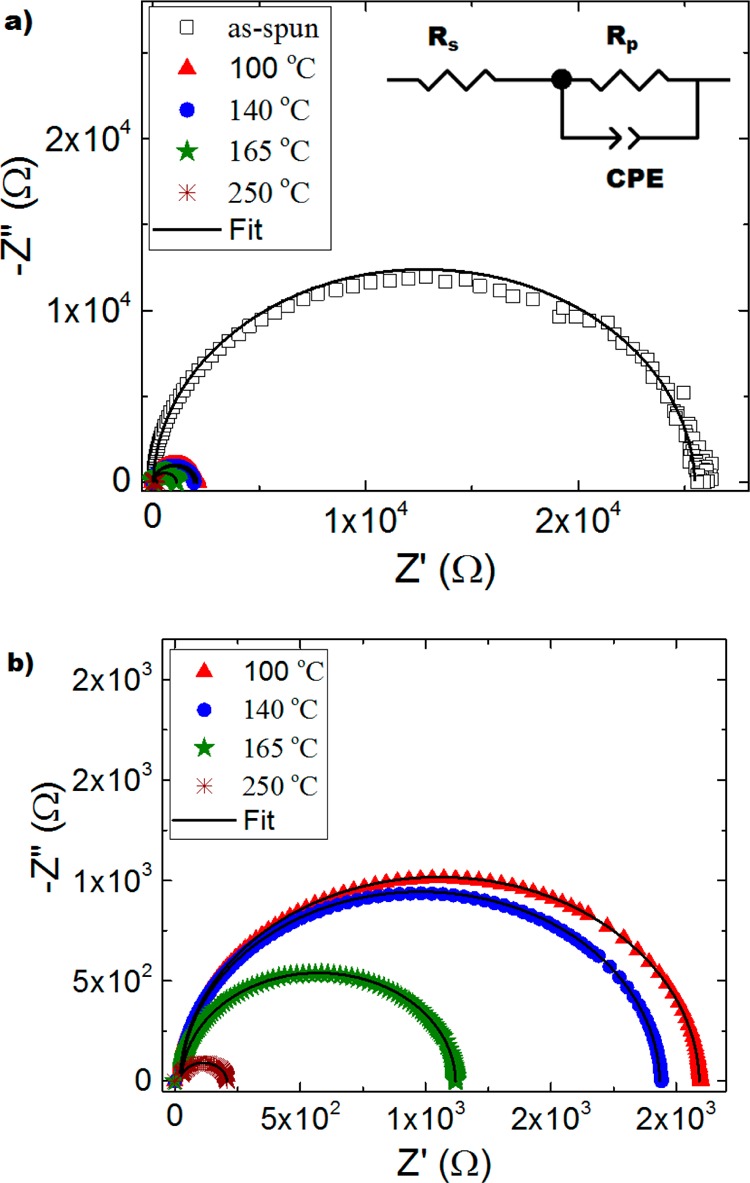
Figure 8.

(a) Nyquist plots (−Z″ versus Z′) from the impedance data taken over a frequency range between 1 MHz and 10 Hz). (b) Zoom-in of the impedance data from the diodes prepared with annealed films (100 °C, red triangles; 140 °C −, blue circles; 165 °C, green stars; and 250 °C, wine crosses).
