
Figure 9.
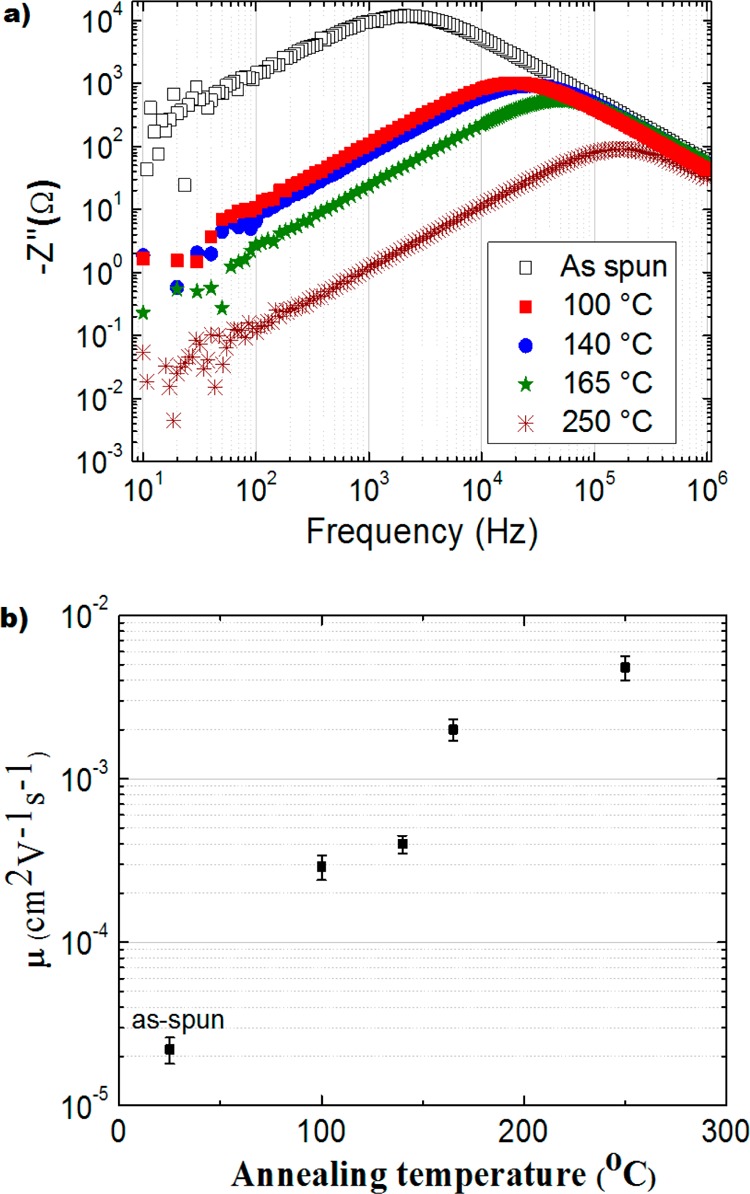
(a) Bode plots for −Z″ versus f spectra for the samples of FPPTB with annealed films (100 °C, red triangles; 140 °C, blue circles; 165 °C, green stars; and 250 °C, wine crosses) and (b) carrier mobility in FPPTB versus annealing temperature.