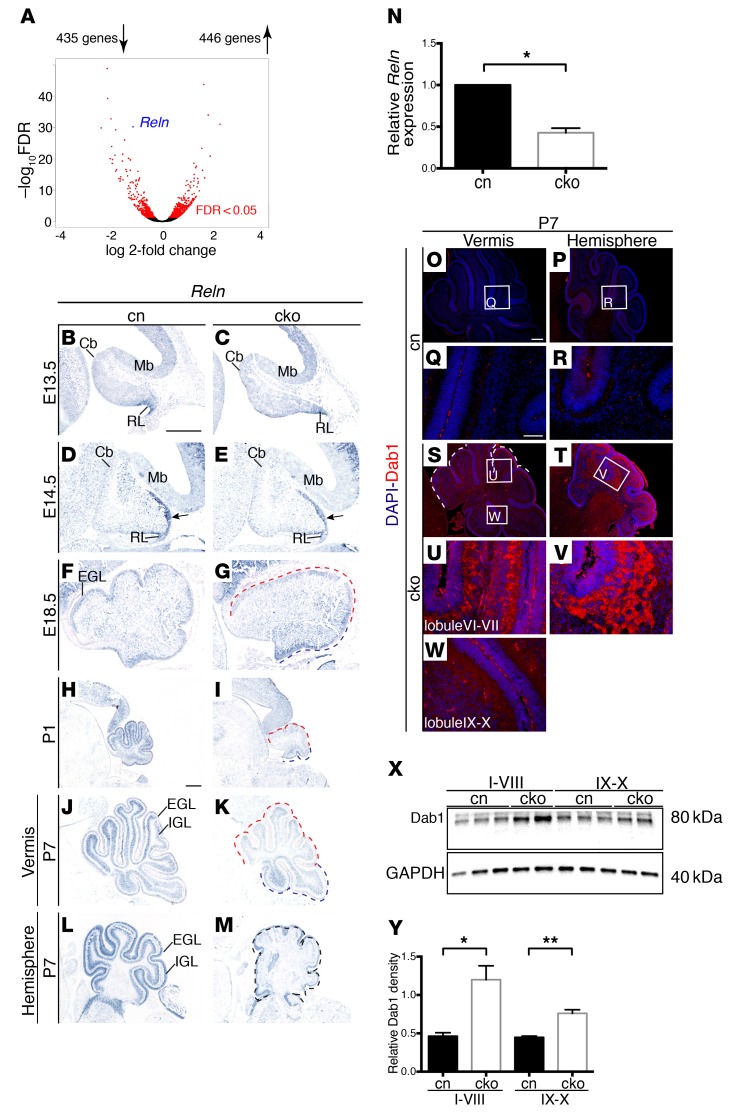
Figure 5. CHD7 regulates Reln gene expression in GCps.
(A) Volcano plot of RNA-Seq data comparing gene expression of purified GCps from P7 cko and cn mice. Red points indicate genes with statistically significant (FDR < 0.05, n = 2) differences in expression. Reln is highlighted in blue. (B–M) In situ hybridization with an antisense Reln probe on sagittal cerebellar sections at the indicated time points. Note reduced Reln expression in the rhombic lip stream at E14.5 (arrow in E), anterior vermis of E18.5, P1, and P7 cerebella (red dashed line in G, I, and K), and all lobules of the hemispheres at P7 (M), with normal expression in the posterior vermis (navy dashed line in G, I, and K). IGL, internal granule layer. (N) Quantification of Reln transcript levels in purified P7 GCps confirms significant reduction in Reln expression in cko GCps (3 samples of purified GCps extracted from pooled cerebellar samples of each genotype). (O–W) Immunostaining for DAB-1 on sagittal sections of P7 mouse cerebella. High-magnification views of indicated regions in O, P, S, and T are shown in Q, R, and U–W, respectively. Increased DAB-1 protein levels in the anterior vermis lobules and hemisphere of cko mice are indicative of reduced RELN signaling. (X) Western blot analysis of DAB-1 protein levels in lobules I–VIII and IX–X. Note the increase in protein levels in cko samples (n = 3) compared with cn (n = 2), with more marked increases identified in lobules I–VIII of the cko. (Y) DAB-1 protein levels quantified relative to GAPDH. *P < 0.05, **P < 0.01, Student’s t test. Scale bars: 300 μm (B, H, and O), 100 μm (Q).

