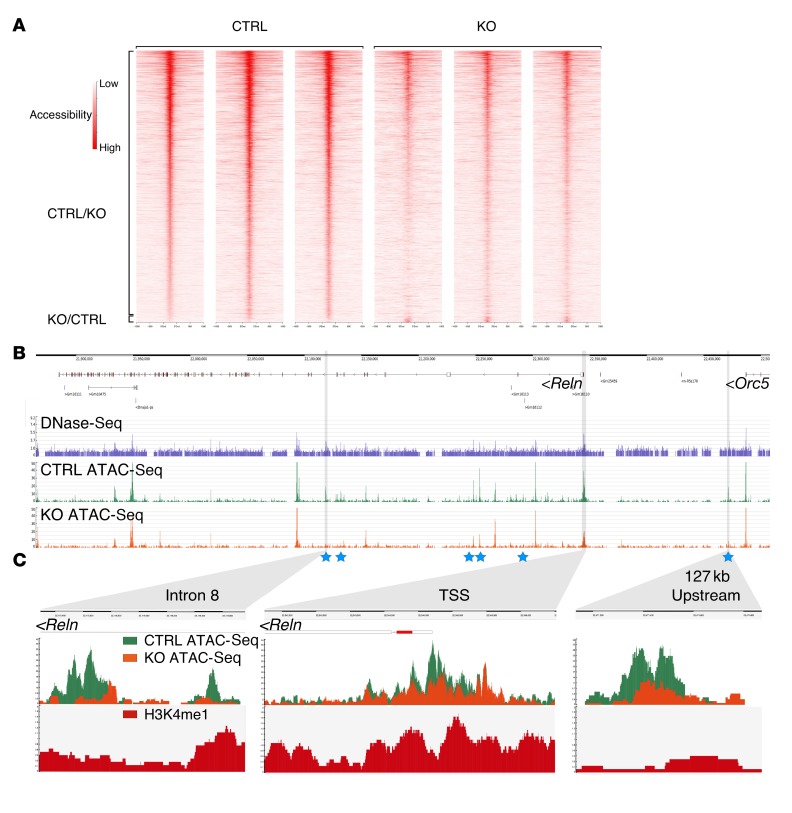
Figure 7. CHD7 deletion alters chromatin organization and reduces DNA accessibility at the Reln locus.
(A) Heatmaps representing all significantly changed ATAC-Seq peaks ± 500 bp between control (CTRL) and cko (KO) GCps (n = 3). Note reduced DNA accessibility in KO samples for the majority of peaks (CTRL/KO peaks), with a few showing increased DNA accessibility in the KO (KO/CTRL peaks). (B) DNase-Seq (purple) (45) and ATAC-Seq reads mapped over the Reln gene in control (CTRL ATAC-Seq, green) and cko (KO ATAC-Seq, orange) P7 GCps. Peaks are indicative of regions of “open” chromatin with high DNA accessibility. Blue stars indicate ATAC-Seq peaks that are significantly different in CTRL and KO cells. (C) Visualization of normalized CTRL (green) and KO ATAC-Seq (orange) reads, and H3K4me1 ChIP-Seq reads from WT GCps (red) that mapped to intron 8, the Reln transcriptional start site (TSS), and a region 127 kb upstream of the Reln TSS. Note significantly reduced DNA accessibility at the intronic and upstream regions in KO cells compared with CTRL cells.

