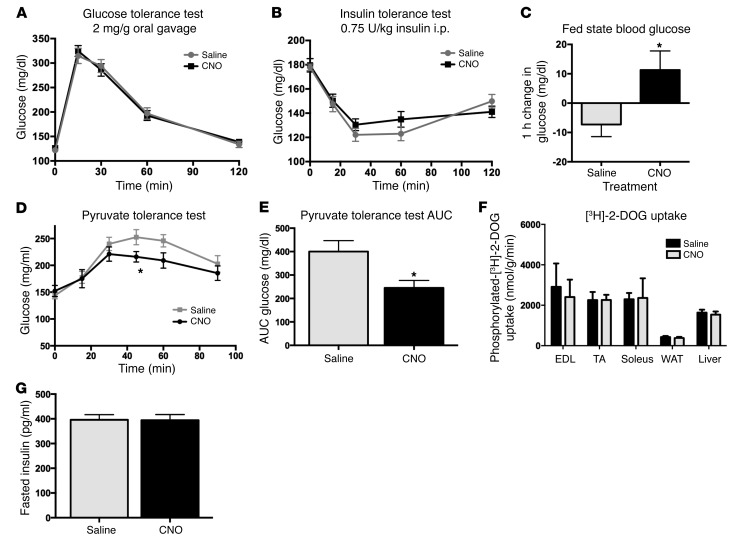
Figure 5. GCG neuronal activation produces a selective effect on glucose homeostasis.
Insulin secretion and insulin sensitivity were not affected by CNO treatment (A, 2-way repeated measures ANOVA, F1,11 = 0.04572, P = 0.8346; B, 2-way repeated measures ANOVA, F1,15 = 0.4948, P = 0.4926). Fed-state blood glucose levels showed a modest increase 1 hour after CNO delivery as compared with saline treatment (C, paired t test, *P = 0.038). i.p. pyruvate tolerance test showed a reduction in gluconeogenesis (D, 2-way repeated measures ANOVA, significant effect of treatment, F5,35 = 24.24, *P = 0.0001; E, area under the curve, paired t test, *P = 0.0304). 2-Deoxyglucose uptake assay showed no effect of CNO on glucose disposal (F, t test for each tissue sourced from saline- and CNO-treated animals, EDL t = 0.3492, P = 0.7388; TA t = 0.007964, P = 0.9939; soleus t = 0.893, P = 0.398; WAT t = 0.5955, P = 0.5732; liver t = 0.4717, P = 0.6538). Finally, fasted insulin levels were unchanged (G, t test, n = 8, t = 0.056, P = 0.956).

