Abstract
Disruption of the retinoblastoma (RB) tumor suppressor pathway, either through genetic mutation of upstream regulatory components or mutation of RB1 itself, is believed to be a required event in cancer. However, genetic alterations in the RB-regulated E2F family of transcription factors are infrequent, casting doubt on a direct role for E2Fs in driving cancer. In this work, a mutation analysis of human cancer revealed subtle but impactful copy number gains in E2F1 and E2F3 in hepatocellular carcinoma (HCC). Using a series of loss- and gain-of-function alleles to dial E2F transcriptional output, we have shown that copy number gains in E2f1 or E2f3b resulted in dosage-dependent spontaneous HCC in mice without the involvement of additional organs. Conversely, germ-line loss of E2f1 or E2f3b, but not E2f3a, protected mice against HCC. Combinatorial mapping of chromatin occupancy and transcriptome profiling identified an E2F1- and E2F3B-driven transcriptional program that was associated with development and progression of HCC. These findings demonstrate a direct and cell-autonomous role for E2F activators in human cancer.
Introduction
The E2F family of transcription factors consists of 8 members that can be organized into 3 subcategories based on function and expression patterns during the cell cycle: activators (E2F1-3), canonical repressors (E2F4–6), and atypical repressors (E2F7 and E2F8). The complexity of the E2F family is further increased by differential promoter usage and splicing, resulting in multiple E2F isoforms (1–5). Through sequential binding to target promoters, E2F activators and repressors are believed to choreograph the oscillatory nature of cell cycle–dependent gene expression (6–8).
E2Fs play a critical role in the control of cellular proliferation (9–13). In fruit flies, which have a single E2F activator (dE2f1) and repressor (dE2F2), the ablation of dE2F1 is sufficient to cause cell proliferation arrest at the larval stage, leading to embryo lethality (6, 14). In plants and mammals, which have multiple activator and repressor family members, ablation of individual E2fs has minimal impact on cell proliferation and embryonic development (15, 16). When activator or repressor subgroups are ablated in combination, however, a spectrum of developmental abnormalities is observed, including wide-spread DNA damage and apoptosis, organ-specific atrophy, restricted organismal growth, and animal lethality (15, 16). Why such diversity in the number and types of E2F components exists among eukaryotic species remains a matter of speculation.
Physical interaction of the tumor suppressor retinoblastoma 1 (RB1) with E2F transcription factors inhibits E2F-dependent gene expression and is believed to underlie RB1 tumor suppressor function (12, 16–19). In humans, germline mutations in RB1 lead to retinoblastoma at a young age and affected individuals have a strong susceptibility to a number of other malignancies (20). Inactivation of the RB pathway, either through amplification of negative regulators (CDK4, CDK6, CCND1, or CCNE2), genetic or epigenetic inactivation of positive regulators (p16INK4A, p18INK4c, and p27KIP1), or mutations in RB1 itself, is frequently detected in cancer (21, 22). This has led to the view that disruption of the RB/E2F pathway leading to increased E2F transcriptional activity is a universal requirement for cancer development (23, 24). The observation that unregulated cell proliferation as a consequence of Rb1 deficiency in mice is blocked by the ablation of E2F activators suggests that E2Fs are critical downstream effectors of RB1 tumor-suppressor function (13, 25). Consistent with these findings, deletion of the RB family or supraphysiological overexpression of E2Fs leads to hepatocellular carcinoma (HCC) in mice (26, 27). Yet despite extensive efforts, genetic alterations in E2F genes are only rarely found in human tumors, casting doubt on a direct role of E2Fs in cancer. One explanation for this paucity of genetic alterations in E2Fs may be related to the ability of RB1 to physically interact with over 150 other factors, many of which also have implicit or explicit connections to cancer (28). Thus, it is entirely possible that RB1’s tumor suppression function may reside, at least in part, outside the regulation of E2F activity and within the control of one or more of its many associated proteins.
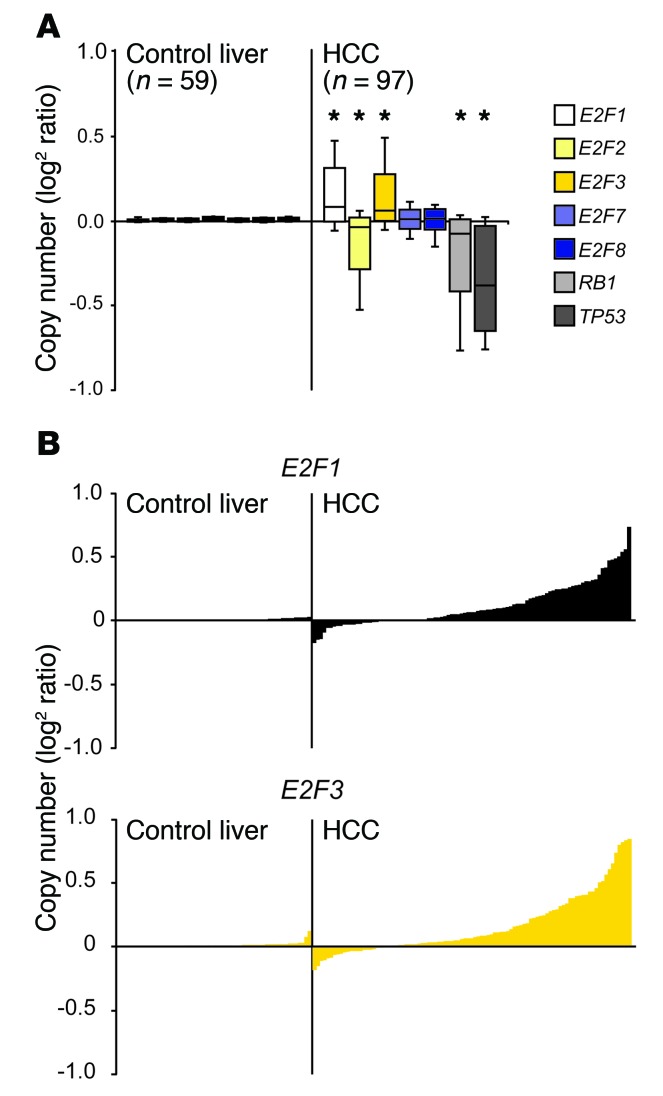
To explore a possible role for E2Fs in human cancer, we queried recently generated public databases for genetic alterations in E2F family members. This analysis revealed very modest but significant (P < 0.001) increases in E2F1 and E2F3 gene dosage in tumors from advanced HCC patients (Figure 1A). Here, we used a series of loss- and gain-of-function alleles to modulate the levels of E2F1, E2F3A, and E2F3B expression in mice and evaluated their role in cancer. This analysis shows that copy number gains in E2f1 or E2f3b led to increased E2F output and a striking incidence of spontaneous HCC without affecting development at any stage, from fetal to adult. Hepatocyte-specific restoration of E2f1 copy number to normal levels prevented spontaneous development of HCC, suggesting a cell-autonomous role for E2F1 in driving HCC. Conversely, decreased E2F output in E2f1–/– and E2f3b–/– mice protected against carcinogen-induced HCC. Further genetic and mechanistic studies identified critical molecular differences between family members that could explain the selective and potent dosage-dependent oncogenic roles of E2F1 and E2F3B. These findings expose how the precise composition of E2F family members is required to control transcriptional specificity and output in order to foster a cancer-free life span.
Figure 1. Copy number gains in E2F1 and E2F3 in human primary liver cancer.
(A) Box plots illustrating copy number variations in E2F pathway genes in normal liver and HCC samples using values from the TCGA database. The center lines in boxes represent the median. The boxes represent the first and third quartiles, and the whiskers represent the highest and lowest values. *P < 0.001, 2-sided Student’s t test vs. control liver. (B) An alternate view of the box plots shown in A. Levels of copy number variations are shown on the y axis and individual patients on the x axis.
Results
Copy number gains in E2F1 and E2F3 in human HCC.
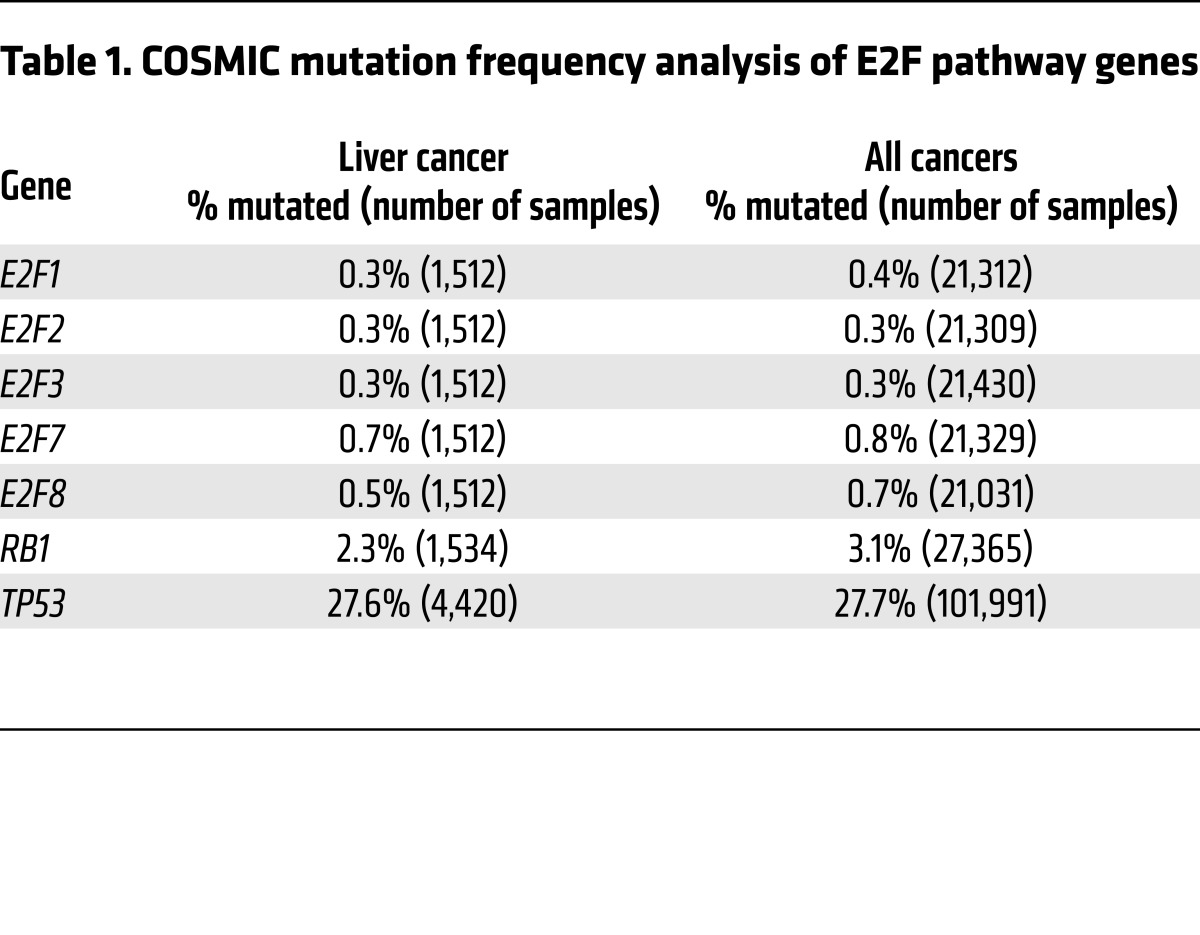
To explore whether altered E2F signaling may be directly related to development of human cancer, we queried The Cancer Genome Atlas (TCGA; https://tcga-data.nci.nih.gov/docs/publications/tcga/) and Catalogue of Somatic Mutations in Cancer (COSMIC; http://cancer.sanger.ac.uk/cosmic) databases for genetic and epigenetic alterations in E2F family members. As previously noted by others, genetic alterations in E2Fs are infrequent in most solid tumor types. However, we found subtle but significant E2F1 and E2F3 copy number gains and E2F2 copy number losses in HCC (Table 1, Figure 1, and Supplemental Figure 1; supplemental material available online with this article; https://doi.org/10.1172/JCI87583DS1). As expected, there were also frequent mutations and gene copy losses in RB1 and TP53 tumor suppressors. These findings suggest that while relatively rare across most cancer types, modest genetic alterations in select E2F activators may be associated with development of HCC. A tumor-suppressive role for E2F2 was previously identified in B and T cell lymphomagenesis (29, 30), which may reflect copy number losses observed here in HCC. We thus focused subsequent analysis on the relevance of E2F1 and E2F3 copy number gains in cancer.
Table 1. COSMIC mutation frequency analysis of E2F pathway genes.
Loss of E2f1 and E2f3b protects against HCC.
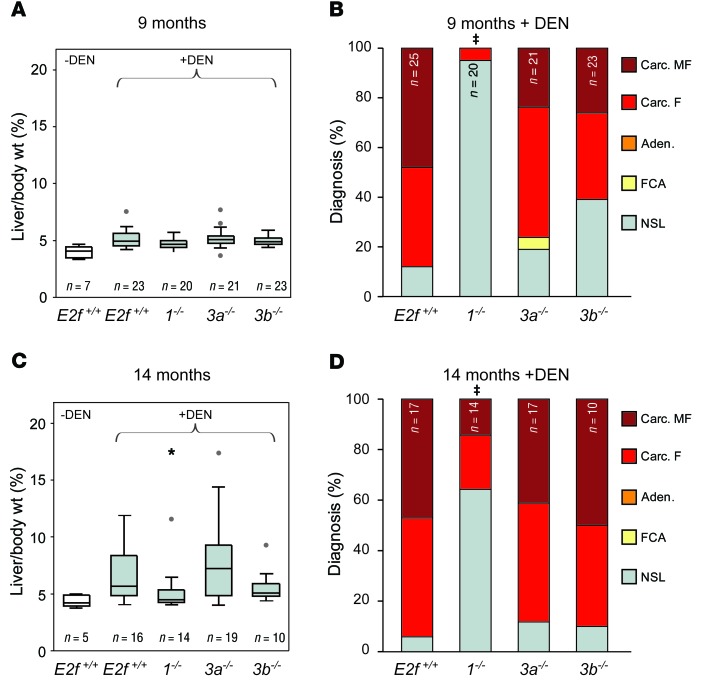
The E2F3 gene locus encodes 2 isoforms regulated by distinct promoters, generating proteins that differ at their N termini (E2F3A and E2F3B). We initially took a loss-of-function genetic approach to determining whether E2F1 and the 2 E2F3 isoforms contribute to HCC. To this end, HCC development was evaluated in E2F+/+ , E2f1–/–, E2f3a–/–, and E2f3b–/– mice (hereafter referred to as E2f+/+, 1–/–, 3a–/–, and 3b–/– mice, respectively; refs. 31, 32) treated with the liver-specific carcinogen diethylnitrosamine (DEN; ref. 33). The liver–to–body weight ratio of untreated mice did not differ among genetic groups (Supplemental Figure 2A). Small macroscopic liver tumors were visible in 9-month-old DEN-treated E2f+/+, 3a–/–, and 3b–/– mice, but not in 1–/– mice (Figure 2A and Supplemental Figure 2, B and C). A detailed pathological evaluation incorporating known criteria associated with disease progression and poor prognosis (Supplemental Table 1; ref. 34) showed less advanced disease in 1–/– and 3b–/– mice than in 3a–/– or E2F+/+ mice (Table 2 and Figure 2B). A reduction in tumor incidence and tumor burden was also observed in 14-month-old 1–/– mice (Table 3, Figure 2, C and D; and Supplemental Figure 2, D and E). These observations suggest that decreased dosage of specific E2Fs protect against cancer.
Figure 2. Ablation of E2f1 or E2f3b, but not E2f3a, decreases HCC severity in mice.
(A) Box plots showing the ratio of liver vs. body weight (liver/body wt.) of 9-month-old WT (E2f+/+) and E2f knockout male mice. Non–DEN-treated cohorts are in white, and DEN-treated are shown in gray. The center lines in boxes represent the median. The box represents the first and third quartiles, and the whiskers represent the highest and lowest values. Outliers are represented by gray dots. (B) Histopathological classification of mice from A. Carc. MF, carcinoma multifocal; Carc. F, carcinoma focal; Aden, adenoma; FCA, focal cellular atypia; NSL, no significant lesions. Fisher’s exact tests with Bonferroni’s correction for multiple tests. ‡P ≤ 0.001, carcinoma (focal/multifocal) vs. E2f+/+. (C) Box plots showing liver/body weight of 14-month-old male mice. Non–DEN-treated cohorts are in white, and DEN-treated are shown in gray. *P = 0.040, 1–/– vs. E2f+/+ liver; Wilcoxon method with Bonferroni’s correction. (D) Histopathological classification of mice from C. Fisher’s exact tests with Bonferroni’s correction. ‡P ≤ 0.003, carcinoma vs. E2f+/+.
Table 2. Pathologic scores ± SEM of DEN-treated E2F knockout mice at 9 months.
Table 3. Pathologic scores ± SEM of DEN-treated E2F knockout mice at 14 months.
E2f1 and E2f3b are critical drivers of HCC.
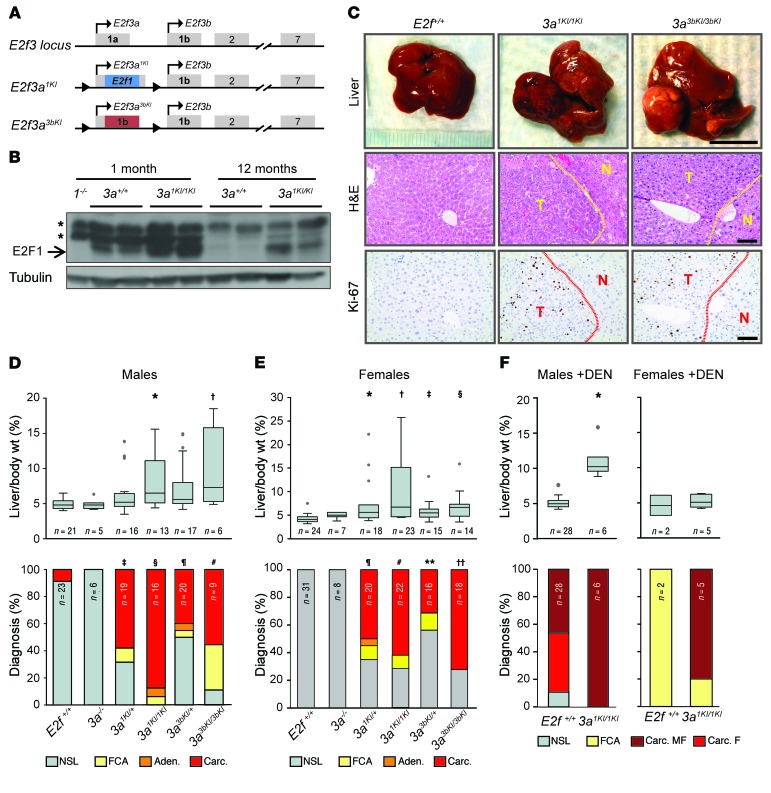
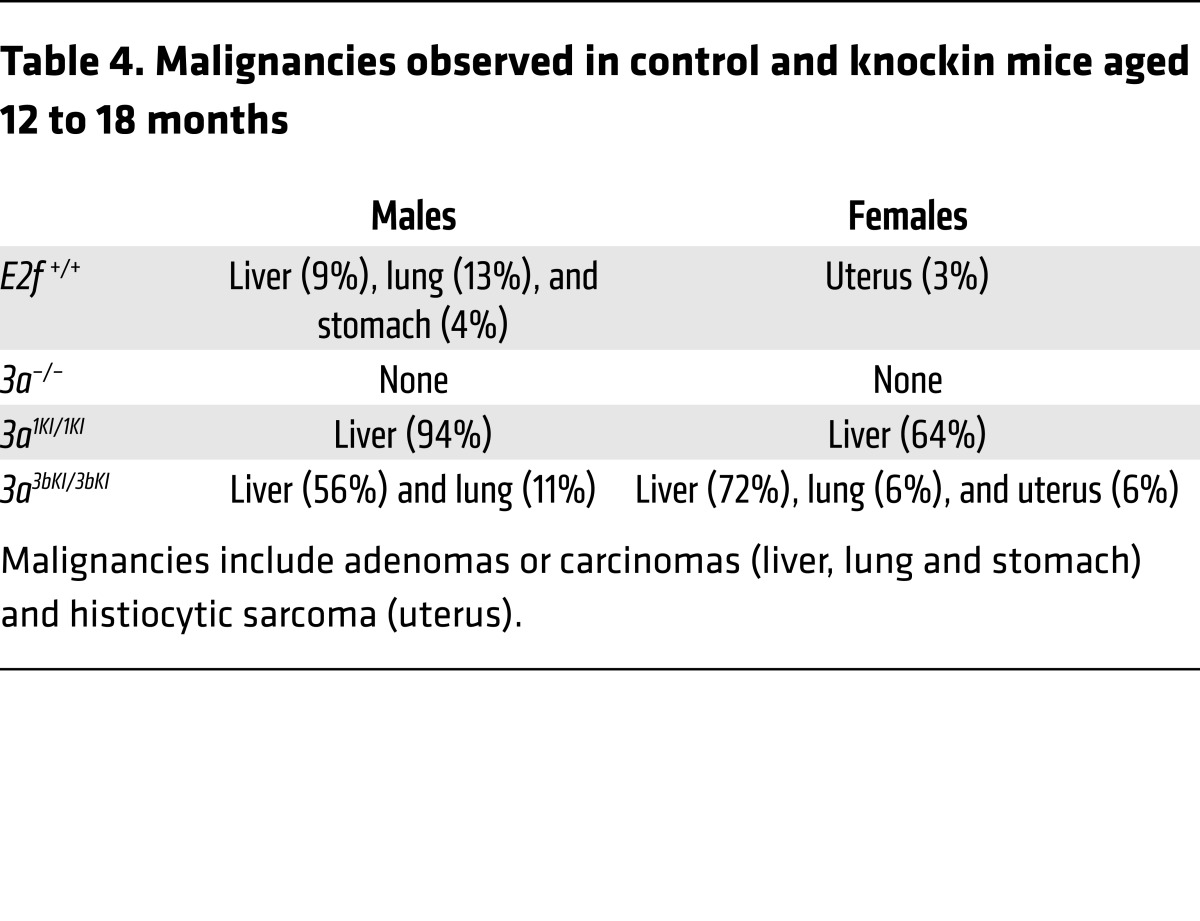
The observation that E2F1 and E2F3B have specific roles in driving cancer is interesting given our previous studies showing that E2F1, E2F3A, and E2F3B proteins are interchangeable during fetal to early adult development (32). In these studies, knockin strategies showed that expression of E2f1 or E2f3b from the E2f3a locus (referred to hereafter as 3a1KI and 3a3bKI, respectively) fostered normal fetal to adult development, suggesting redundant developmental functions for E2F activators. However, aging cohorts of knockin mice were never analyzed. Thus, we evaluated the life-long consequences of having 1 or 2 extra copies of E2f1 or E2f3b in 3a1KI and 3a3bKI knockin mice (Figure 3A). Cohorts of 18-month-old E2f+/+ and 3a–/– control mice appeared normal, and necropsies revealed only rare age-related lesions (Table 4). In contrast, the majority of 3a1KI/1KI and 3a3bKI/3bKI knockin mice developed spontaneous liver masses. Thus, despite the widespread expression of E2f1 or E2f3b from the E2f3a locus in all proliferating tissues of the mouse (32), frequent lesions were only observed in livers. We confirmed higher levels of E2F1 and E2F3B protein in livers from knockin mice than in controls (Figure 3B and Supplemental Figure 3). The majority of liver masses were characterized as highly proliferative HCC in the absence of excessive apoptosis as measured by Ki-67 and caspase 3 (Figure 3, C–E; caspase 3 data not shown). Analysis of heterozygous 3a1KI/+ and 3a3bKI/+ mice displayed an intermediate level of spontaneous HCC (Figure 3, D and E). Furthermore, 3a1KI/1KI mice were also more sensitive to carcinogen-induced (DEN) HCC than control mice (Figure 3F). Interestingly, whether HCC developed spontaneously or was accelerated by DEN treatment, tumor burden was higher in males than females, consistent with the known sex bias for HCC development in humans (Figure 3, E and F; refs. 33, 35, 36).
Figure 3. Copy number increases in E2f1 or E2f3b result in HCC.
(A) Diagram of the murine E2f3 locus and E2f knockin alleles where the coding region of E2f1 or exon 1 of E2f3b has been inserted into the first exon of E2f3a, resulting in the loss of E2f3a and expression of E2f1 (3a1KI) or E2f3b (3a3bKI) driven by the E2f3a promoter. (B) Immunoblot of 1- and 12-month-old liver extracts from 3a1KI/1KI mice. The blot was probed with an E2F1-specific antibody. Liver from 1–/– mice was used to validate the antibody. Asterisks indicate nonspecific bands, and tubulin was used as a loading control. (C) Representative pictures of livers from 12- to 18-month-old mice (top), sections stained with H&E (middle), or probed with Ki-67–specific antibodies (bottom). Areas of HCC are outlined by dotted lines. T, tumor; N, normal liver. Scale bars: 1 cm (top); 100 μm (middle and bottom). (D) Box plots showing the liver/body weight of male mice from C (top): *P = 0.012, E2f3a1KI/1KI vs. E2f+/+; †P = 0.043, E2f3a3bKI/3bKI vs. E2f+/+, Wilcoxon method with Bonferroni’s correction for multiple tests. Histopathological classification (bottom): ‡P = 0.002, E2f3a1KI/+ vs. E2f+/+; §P < 0.001, E2f3a1KI/1KI vs. E2f+/+; ¶P = 0.032, E2f3a3bKI/+ vs. E2f+/+; #P = 0.02, E2f3a3bKI/3bKI vs. E2f+/+, Fisher’s exact tests with Bonferroni’s correction. (E) Box plots showing the liver/body weight of female mice from C (top): *P = 0.002, E2f3a1KI/+ vs. E2f+/+; †P = 0.001, E2f3a1KI/1KI vs. E2f+/+; ‡P = 0.015, E2f3a3bKI/+ vs. E2f+/+; §P = 0.005, E2f3a3bKI/3bKI vs. E2f+/+, Wilcoxon method with Bonferroni’s correction. Histopathological classification (bottom): ¶P < 0.001, E2f3a1KI/+ vs. E2f+/+ liver; #P < 0.001, E2f3a1KI/1KI vs. E2f+/+ liver; **P = 0.014, E2f3a3bKI/+ vs. E2f+/+ liver; ††P < 0.001, E2f3a3bKI/3bKI vs. E2f+/+ liver, Fisher’s exact tests with Bonferroni’s correction. (F) Box plots showing the liver/body weight (top) or bar graph showing histopathological classification (bottom) of DEN-treated E2f+/+ and 3a1KI/1KI male mice at 9 months of age.
Table 4. Malignancies observed in control and knockin mice aged 12 to 18 months.
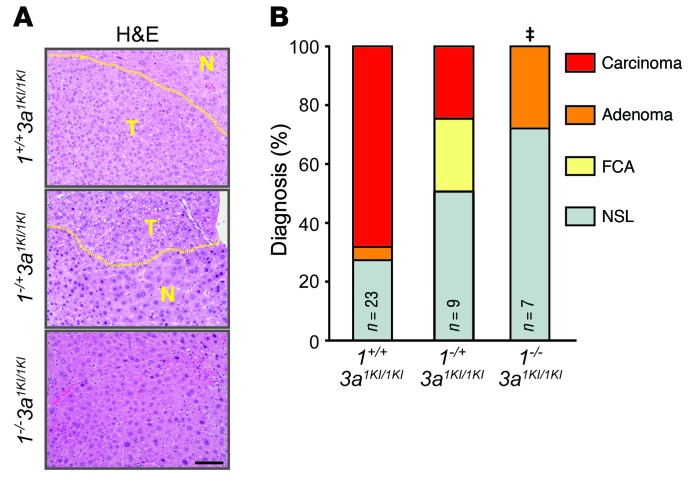
To rule out any possible contribution due to the inadvertent disruption of regulatory sequences caused by insertion of the knockin alleles into the E2f3a locus, we evaluated HCC development in 3a1KI/1KI mice lacking the endogenous E2f1 gene. This analysis revealed a dose-dependent reduction in the grade of lesions observed in knockin mice lacking 1 (1–/+3a1KI/1KI) or both (1–/–3a1KI/1KI) endogenous copies of E2f1 (Figure 4, A and B). Thus, we conclude that the total levels of E2F1 protein dictate tumor outcome regardless of the genomic location of the gene. These findings formally demonstrate that increased E2F1 gene dosage, culminating in higher E2F1 protein levels, leads to spontaneous and DEN-induced HCC in mice.
Figure 4. E2f1 gene dosage affects liver cancer in 3a1KI/1KI mice.
(A) Representative photographs of H&E-stained livers from 1+/+3a1KI/1KI, 1–/+3a1KI/1KI, and 1–/–3a1KI/1KI mice at 1 year. Areas of HCC are outlined by dotted lines. Scale bar: 100 μm. (B) Histopathological classification of livers of mice from A. Fisher’s exact tests with Bonferroni’s correction for multiple tests. ‡P = 0.019, carcinoma compared with 1+/+3a1KI/1KI.
Oncogenic function of E2f1 is cell autonomous.
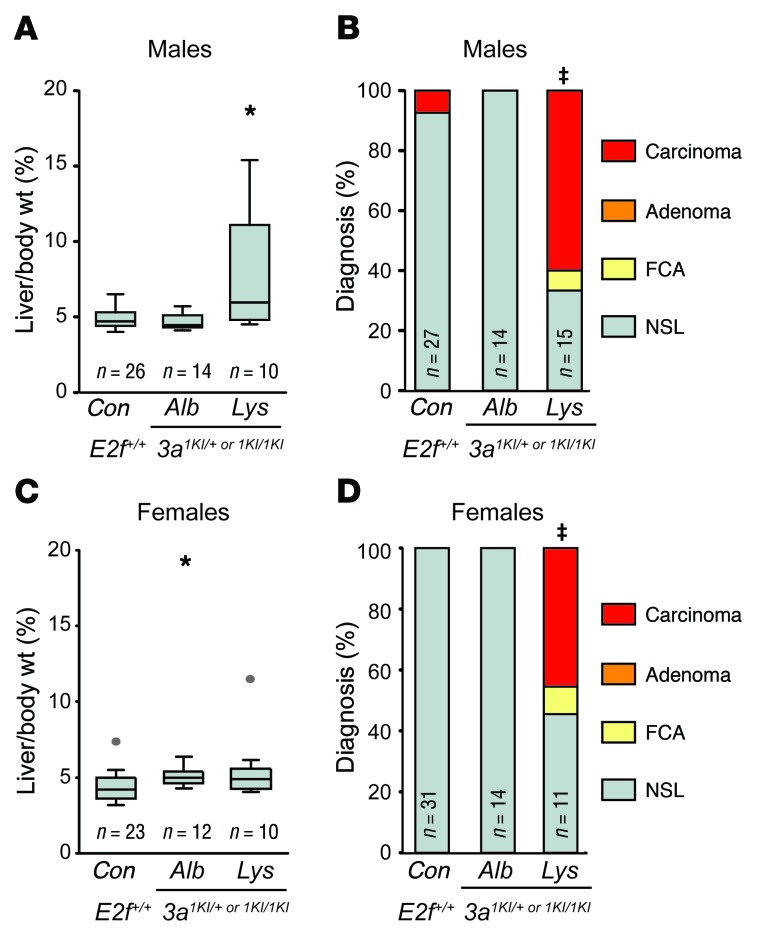
Several factors contribute to HCC, including hepatitis B or C virus infection, heavy alcohol consumption, aflatoxin exposure, Western-style diet, obesity, and diabetes (37). The exact mechanism of how these varied factors promote HCC is unclear, but chronic inflammation and liver damage leading to further genomic instability likely contribute to this disease (37, 38). Kupffer cells are abundant liver-resident macrophages that have been implicated in the development of HCC by promoting inflammation, angiogenesis, and epithelial-to-mesenchymal transition (39). E2f1 and E2f3a are expressed in proliferating tissues and are particularly high in lymphoid and myeloid lineages (4). Therefore, we considered the possibility of a cell-nonautonomous oncogenic role for E2F1 in HCC. By taking advantage of LoxP sites flanking the 3a1KI allele (Figure 3A), we assessed spontaneous HCC in aging cohorts of mice with hepatocyte- or monocyte-specific expression of Cre (40, 41). Tumor incidence and tumor burden were increased in monocyte-ablated mice (Lys-Cre 3a1KI/+ and Lys-Cre 3a1KI/1KI) to an extent similar to that seen in 3a1KI/+ and 3a1KI/1KI mice (Figure 5, A–D), indicating that E2f1 in Kupffer cells is unlikely to play a major role in HCC development. In contrast, there was a complete absence of liver lesions in hepatocyte-ablated mice (Alb-Cre 3a1KI/+ and Alb-Cre 3a1KI/1KI), just as in E2f+/+ control mice. Together, these studies suggest a cell-autonomous oncogenic role for E2f1 in hepatocytes.
Figure 5. Oncogenic functions of E2f1 and E2f3b are cell autonomous.
(A) Box plots showing the liver/body weight of 12- to 18-month-old male mice in which the knockin allele or alleles have been deleted in hepatocytes or macrophages using Alb-Cre or Lys-Cre, respectively. Wilcoxon method with Bonferroni’s correction for multiple tests. *P < 0.001 vs. control. (B) Histopathological classification of livers from A. Fisher’s exact tests with Bonferroni’s correction. ‡P = 0.001, carcinoma vs. control. (C) Box plots showing the liver/body weight of 12- to 18-month-old female mice. Wilcoxon method with Bonferroni’s correction. *P < 0.012 vs. control. (D) Histopathological classification of livers from C. Fisher’s exact tests with Bonferroni’s correction. ‡P = 0.001, carcinoma vs. control.
ChIP-seq defines E2F1, E2F3A, and E2F3B chromatin-binding landscapes.
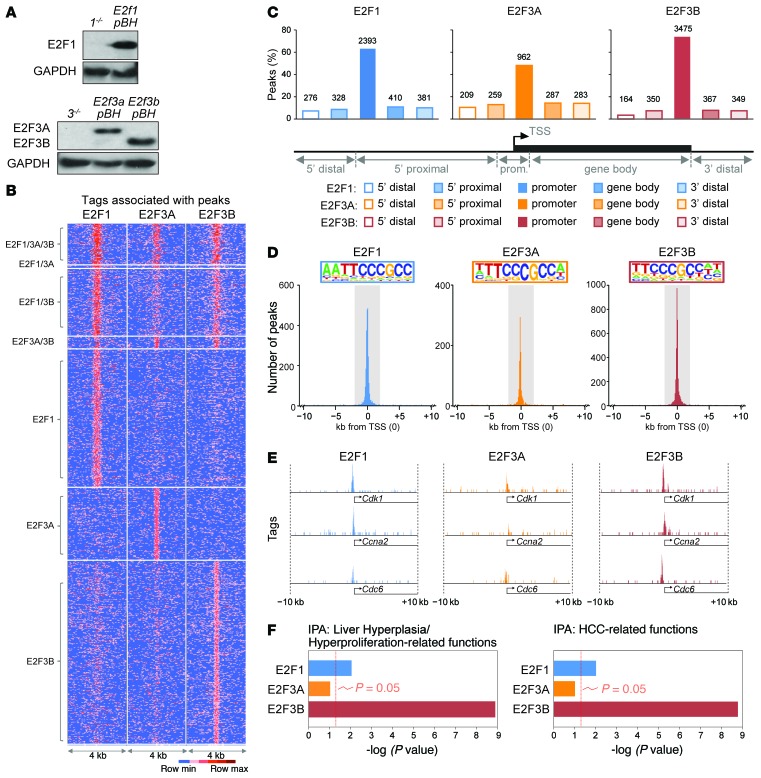
The genetic experiments described above highlight distinct roles of E2F family members in the development of cancer. To explore the underlying mechanism for these observations, we sought to identify and compare the chromatin-binding landscapes of E2F1, E2F3A, and E2F3B by ChIP followed by next-generation sequencing (ChIP-seq). E2F chromatin occupancy was mapped by sequencing ChIP-DNA libraries originating from asynchronous populations of mouse embryonic fibroblasts (MEFs) overexpressing these E2Fs (Figure 6A). DNA-sequencing tags were mapped to the mouse genome and peak summits identified using a combination of HOMER (http://homer.salk.edu/homer/) and MACS (http://liulab.dfci.harvard.edu/MACS/) algorithms. Peaks identified in MEFs were validated in a liver cancer cell line (HepG2) overexpressing each of these E2Fs (Supplemental Figure 4, A–D). The ChIP-seq analysis exposed several expected and unexpected observations. First, we found twice as many E2F1- and E2F3B-specfic peaks as E2F3A-specific peaks (3,788, 4,705, and 2,000 peaks, respectively). While a distinct subset of chromatin locations was equally occupied by all 3 E2Fs, most chromatin locations were specifically enriched for E2F1 and E2F3B (Figure 6B), suggesting selectivity in the chromatin binding of E2F activators. Second, the majority of E2F1, E2F3A, and E2F3B peaks mapped near the transcriptional start site (TSS) (Figure 6C and Supplemental Table 2, 3, and 4), consistent with previous findings (13, 42). Interestingly, promoter-specific peaks ( ± 2 kb from the TSS) were mostly located over canonical E2F consensus-binding sequences (TTCCCGCC; Figure 6D), whereas peaks mapping to other gene regions contained a variety of canonical and noncanonical E2F-binding motifs (Supplemental Table 5). There were typically more read tags per peak in promoters occupied by E2F1 and E2F3B than in promoters occupied by E2F3A (Figure 6E and Supplemental Figure 5A). Third, gene ontology using Ingenuity Pathway Analysis (IPA) software revealed that E2F1- and E2F3B-bound promoters were significantly enriched for genes encoding functions related to hepatocyte proliferation and HCC (CDKN1A, MYC, TRIB1, NFE2L2; Figure 6F and Supplemental Table 6), even though targets were initially identified in MEFs. In contrast, promoters occupied by all 3 E2Fs were enriched for genes with functions in cell cycle control (CDC6, TOP2A, CCNE1, CDT1, CDC25A, MCMs), DNA damage and repair (CHEK1, RAD51, BRCA1, BRCA2), and cell death (XPO1, TP53, WEE1) as well as those that were generally related to cancer (UHFR1, TP53, MYC, BRCA1/2; Supplemental Figure 5B and Supplemental Table 7).
Figure 6. Identification of E2F targets by ChIP sequencing.
(A) Immunoblot of protein lysates from MEFs expressing the indicated E2Fs using the pBABE-Hygro (pBH) vector. E2F1 (E2f1 pBH), E2F3A (E2f3a pBH), and E2F3B (E2f3b pBH); 1–/– and 3–/– MEFs are shown as negative controls. GAPDH was used as a loading control. (B) Sequence tag-density heat map showing the distribution of tags for all E2F1, E2F3A, and E2F3B peaks. (C) Percentages of E2F1, E2F3A, and E2F3B peaks in different gene regions. Gene regions were defined by distance from TSS (TSS = 0) as follows: 5′ distal (–50 Gb to –50 kb), 5′ proximal (–50 kb to -2 kb), promoter (–2 kb to +2 kb), gene body (+2kb to end of transcript), 3′ distal (end of transcript to +30 Gb). Number of peaks is indicated above each bar. (D) Graph depicting the number of peaks for E2F1, E2F3A, and E2F3B identified by ChIP-seq and their location relative to the TSS. The promoter region ( ± 2 kb from the TSS) is highlighted in gray, and the top binding motif identified by de novo HOMER within the promoter region is included in color inserts. (E) E2F1, E2F3A, and E2F3B occupancy on selected gene promoters shown at the same scale. (F) Gene ontology using IPA software depicts the estimated contribution of E2F1, E2F3A, or E2F3B targets to liver hyperplasia and hyperproliferation (left) or HCC-related functions (right). Bars indicate the Benjamini-Hochberg adjusted P value; the threshold of P = 0.05 is shown.
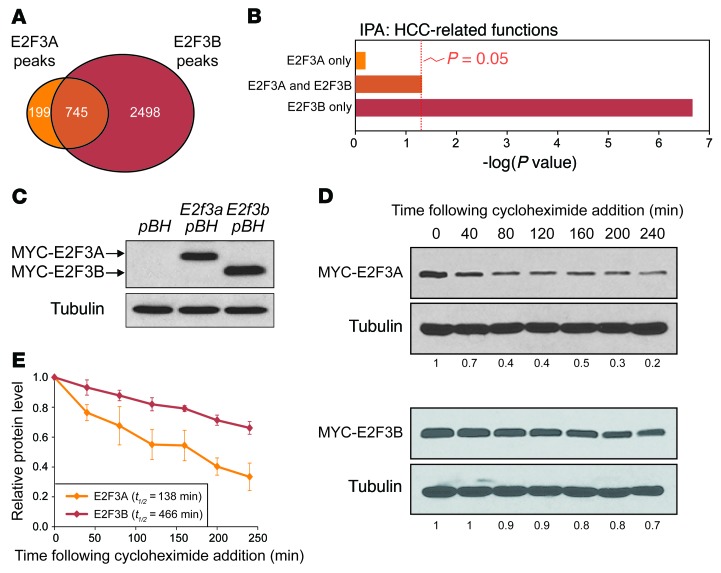
E2F3A and E2F3B share identical DNA binding, dimerization, and transactivation domains and only differ at their N termini (2). Hence, the identification of E2F3B-specific functions in HCC was completely unexpected. Direct comparison between E2F3A and E2F3B chromatin-binding landscapes revealed significant differences in their binding specificity (Figure 7A), and IPA illustrated the remarkable HCC-related nature of E2F3B-specific targets (Figure 7B). We considered that differences in their protein stability may underlie, at least in part, the striking qualitative and quantitative differences between E2F3A and E2F3B chromatin binding. N-terminal sequences within exon 1A of E2f3a, which are absent in E2f3b, have been shown to mediate E2F3A protein degradation (43). Thus, we compared the stability of E2F3A and E2F3B proteins following treatment of cells with cycloheximide. These time-course experiments showed that the half-life of E2F3B was significantly longer than that of E2F3A (>3-fold; Figure 7, C–E). While we have not ruled out additional roles for the N-termini of these 2 isoforms, our findings suggest that protein stability may be a contributing factor to the stronger and broader target-binding range of E2F3B. In short, genome-wide chromatin occupancy analysis exposed both shared and unique targets of E2Fs, with E2F1 and E2F3B binding preferentially to target promoters with functions that are highly related to development of HCC.
Figure 7. Measurement of E2F3A and E2F3B protein stability.
(A) Venn diagram illustrating the overlap of genes that are bound by E2F3A and E2F3B in the promoter region (±2 kb from the TSS). (B) Gene ontology using IPA software showing the estimated contribution of different groups of E2F3A and E2F3B target genes identified in A to HCC-related functions. Bars indicate the Benjamini-Hochberg adjusted P value; the threshold of P = 0.05 is shown. (C) Immunoblot showing the stable overexpression of MYC-tagged E2F3A or E2F3B in MEFs. Antibodies against the MYC epitope were used to detect tagged proteins, and tubulin was used as a loading control. (D) Cycloheximide time course of MEFs stably overexpressing MYC-tagged E2F3A or E2F3B. Protein levels of E2F3A and E3F3B were measured by Western blotting at the indicated time points following cycloheximide treatment (10 μg/ml). Antibodies against the MYC epitope were used to detect tagged proteins. Tubulin was used as a loading control. Quantification of E2F3A and E2F3B protein relative to time = 0 is indicated below each blot. (E) Quantification of E2F3A and E2F3B protein stability as described in D. Means of 3 experiments are shown. Error bars indicate ± SEM. t1/2 is the estimated half-life of the protein. The stability of E2F3A and E2F3B was found to be different by Wilcoxon signed rank test using the average of each time point (P < 0.05).
Identification of putative direct HCC-specific targets of E2F1 and E2F3B.
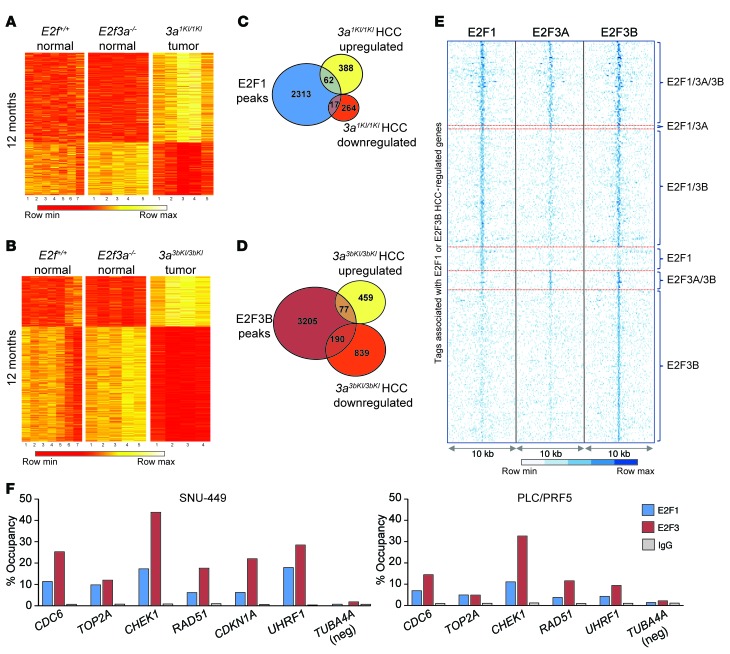
We then hypothesized that increased chromatin binding due to copy number gains in E2f1 and E2f3b led to increased E2F transcriptional output. To test this hypothesis, we used an Affymetrix platform to profile mRNA expression in livers of 12-month-old E2f+/+ (normal), 3a–/– (normal), 3a1KI/1KI (tumor), and 3a3bKI/3bKI (tumor) mice. Genes differentially expressed in 3a1KI/1KI and 3a3bKI/3bKI tumors relative to 3a–/– control samples are represented as heat maps (fold change ≥ 1.5 vs. P ≤ 0.05; Figure 8, A and B; and Supplemental Tables 8 and 9). Levels for most differentially expressed genes were similar between control E2f+/+ and 3a–/– samples. Upregulated mRNAs in 3a1KI/1KI tumors constituted a larger subset than downregulated mRNAs, consistent with a role for E2F1 in transcriptional activation. There was a relatively larger subset of downregulated mRNAs in 3a3bKI/3bKI than in 3a1KI/1KI tumors, possibly reflecting an additional role for E2F3B in transcriptional repression as previously described (1, 2). There was also a marked change in the expression of genes related to cancer, cell cycle control, DNA repair, and metabolic processes as well as cell survival, with a notable absence of genes that induce programmed cell death (Supplemental Figure 6A and Supplemental Table 10). We then plotted the intersection of ChIP and mRNA profiling data sets as tag-intensity maps (Figure 8, C–E; and Supplemental Tables 11 and 12). This analysis showed that 20% of dysregulated genes represent putative direct targets of E2F1 and E2F3B, but not E2F3A. The occupancy of endogenous E2F1 and E2F3 on target promoters was validated by ChIP–quantitative PCR (ChIP-qPCR) in multiple cell lines derived from human liver tumors (Figure 8F and Supplemental Figure 6B).
Figure 8. Intersection of gene-expression profiling and chromatin binding identifies E2F1 and E2F3B targets.
(A) Heat map of Affymetrix microarray data showing differentially expressed genes in 3a1KI/1KI liver tumors when compared with normal liver samples from E2f+/+ and 3a–/– age-matched controls. Differentially expressed genes are defined as having a fold change of 1.5 or more (P ≤ 0.05) relative to 3a–/– samples. (B) Heat map of Affymetrix microarray data showing differentially expressed genes in 3a3bKI/3bKI liver tumors when compared with normal liver samples from E2f+/+ and 3a–/– age-matched controls. Differentially expressed genes are defined as having a fold change of 1.5 or more (P ≤ 0.05) relative to 3a–/– samples. (C) Venn diagram illustrating the overlap of E2F1-specific promoter peaks with upregulated or downregulated genes in 3a1KI/1KI liver tumors identified in A. (D) Venn diagram illustrating the overlap of E2F3B-specific promoter peaks with upregulated or downregulated genes in 3a3bKI/3bKI liver tumors identified in B. (E) Sequence tag-density heat map showing the distribution of E2F1, E2F3A, and E2F3B binding to targets identified in C and D (overlapping groups). (F) ChIP-qPCR validation using E2F1, E2F3, or IgG antibodies in SNU-449 and PLC/PRF5 HCC-derived cells. Occupancy of E2Fs on selected target promoters is shown. A nonpromoter region of TUBA4A (TUBA4A neg) was used as a negative control. Primers were designed to amplify ChIP-seq–identified peak regions.
E2F1 and E2F3B target expression is associated with human HCC.
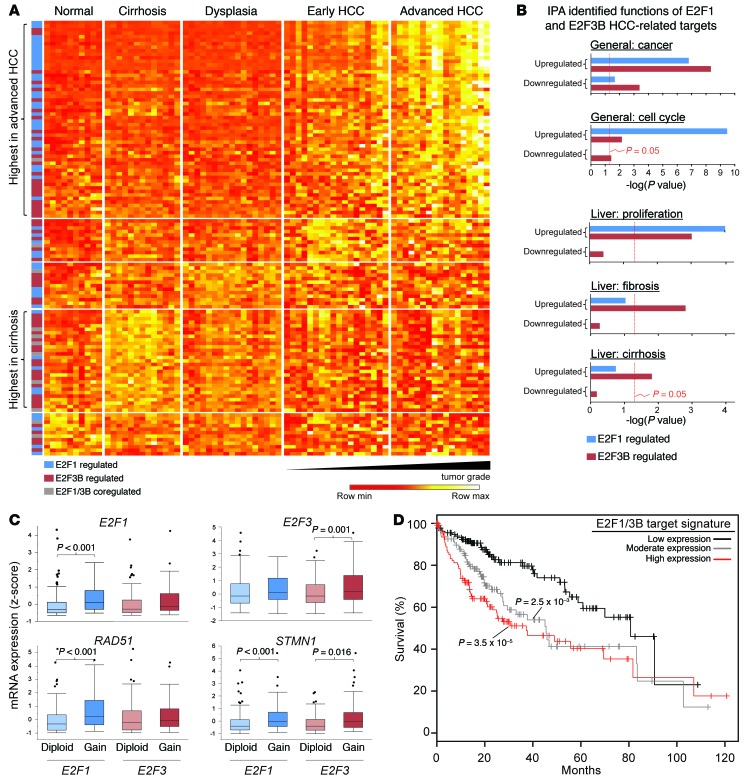
To determine the relevance of our findings to human HCC, we queried the expression of putative E2F1 and E2F3B targets in liver-derived mRNA profiles from healthy individuals and patients with cirrhosis, dysplasia, early HCC, and advanced HCC (44). This analysis revealed a significant and progressive increase in E2F1 and E2F3B target expression in patients with early and advanced HCC (Figure 9A and Supplemental Table 13). Importantly, we also found a subset of genes highly expressed in patients with early stages of liver disease (cirrhosis), the majority of which were E2F3B targets (83%). We then used IPA to query the functions of putative E2F1 and E2F3B targets (Figure 9B, Supplemental Figure 7A, and Supplemental Tables 14, 15, and 16). This analysis revealed a disproportionate enrichment of E2F1 and E2F3B upregulated targets involved in hepatocyte proliferation and cancer. There were also many E2F1- and E2F3B-specific targets with distinct functional roles. For example, many E2F3B-specific targets were uniquely enriched for functions contributing to liver fibrosis and cirrhosis, 2 major predisposing factors contributing to HCC development. In contrast, E2F1 targets were enriched for functions known to participate in canonical cell cycle, checkpoint control, and DNA repair pathways, which are often dysregulated in cancer cells. While the significance of this unexpected observation remains to be determined, we suggest that high E2F3B expression may sensitize livers to cirrhosis and HCC development, while E2F1 may act more directly by altering critical DNA integrity pathways and driving the accumulation of mutations.
Figure 9. Association of the expression of E2F1 and E2F3B targets with human HCC.
(A) Heat map showing the expression of E2F1 and E2F3B upregulated targets in normal and diseased (cirrhosis, dysplasia, early or advanced HCC) human livers. Genes are grouped based on median expression values per patient group. Genes with the highest median expression in advanced HCC and cirrhosis are denoted on the left. (B) Gene ontology using IPA software showing the estimated contribution of E2F1 and E2F3B targets identified in Figure 8 to functions related to cancer, cell cycle, proliferation, fibrosis, and cirrhosis. Bars indicate the Benjamini-Hochberg adjusted P value; the threshold of P = 0.05 is shown. (C) Expression of E2F1 and E2F3B targets in human HCC samples with normal or increased copy numbers of E2F1 and E2F3. E2F1 diploid, 122 samples; gain, 62 samples. E2F3 diploid, 102 samples; gain, 80 samples. Wilcoxon rank sum test Benjamini-Hochberg corrected P values are indicated. (D) Kaplan-Meier plots evaluating the survival time of patients with low to high E2F1/3B target expression. Patients were divided into 3 categories based on target expression. Low expression (0%–5% targets upregulated; black line; n = 136); moderate expression (5%–10% targets upregulated; gray line; n = 113); or high expression (10%–45% targets upregulated; red line; n = 119). log-rank test P values are shown.
Finally, we analyzed E2F1 and E2F3 gene copy number and mRNA expression in HCC patient samples from the TCGA database and found increased expression of E2F1/3 target genes in patients with amplification of E2F1 (P < 0.001) (Figure 9C, Supplemental Figure 7B, and Supplemental Tables 17 and 18). E2F3 copy number gains were correlated to increased expression of fewer target genes. Importantly, increased E2F target gene expression was associated with decreased survival of HCC patients (Figure 9D). In summary, loss- and gain-of-function strategies in mice demonstrate a causative role for E2F1 and E2F3 gene copy number gains in HCC development and expose both shared and unique roles for E2F1 and E2F3B in driving distinct aspects of liver disease.
Discussion
Either through amplification of negative regulators, genetic or epigenetic inactivation of positive regulators, or mutations in RB1 itself, disruption of the RB pathway is believed to be a universal requirement for cancer development (22, 23). However, there is a surprising paucity of genetic alterations in the main downstream transcriptional effectors of RB1, E2Fs, which has cast doubt on their direct involvement in the genesis of cancer. We identified E2F1 and E2F3 copy-number gains in human HCC patients and show in mouse models that these modest genetic alterations are sufficient to initiate HCC. Using a series of E2F alleles to finely tune E2F transcriptional output, we show that increasing output by gains in E2f1 and E2f3b gene-copy numbers leads to HCC development in mice. Remarkably, spontaneous HCC developed in the absence of additional organ-specific cancer types or any significant impact on fetal to adult development. Conversely, decreasing E2F output by E2f1- and E2f3b-specific knockout strategies prevented the development of HCC in mice treated with a liver-specific carcinogen. Mechanistic studies exposed a hepatocyte-specific role for E2F1 and E2F3B in the regulation of a core set of target genes associated with early liver disease and progression to advanced HCC. We propose that mammalian development can tolerate major changes in E2F transcriptional output, but even subtle increases in E2F activity can result in the eventual development of cancer.
Oncogenic functions of E2F1 and E2F3B.
Here, we demonstrate distinct functions for E2F1, E2F3A, and E2F3B in cancer. Tissue-specific overexpression of E2F1 to supraphysiological levels using artificial transgenes has been shown to promote cancer in a variety of organs (26). In this report, we show that introduction of a single extra copy of E2f1 or E2f3b leads to a modest, yet physiologically relevant, increase in E2F1 and E2F3B protein and activity that is sufficient to induce spontaneous HCC in vivo (Figure 3). Substantial sequence differences exist between E2F1 and E2F3A that could explain their distinct biological roles in cancer. However, differences between E2F3A and E2F3B functions are less clear. Given that E2F3A was replaced with E2F3B in the 3a3bKI knockin mouse model described here, we suggest that any biological differences between these 2 isoforms must be independent of regulatory sequences (promoter, intronic, 3′ UTR) and likely due to differences in their protein function. Indeed, E2F3B’s oncogenic role in vivo could be explained, at least in part, by its increased protein stability (Figure 7). While the precise mechanism remains to be elucidated, the observation that a single extra copy of E2f1 or E2f3b resulted in cancer highlights the exquisite functional specificity among E2F family activators in maintaining appropriate transcriptional output necessary for normal liver physiology. While previous knockin studies suggested that E2f1, E2f3a, and E2f3b are interchangeable during development (32), we now describe cancer as the long-term consequence associated with changing the constellation of specific E2F family members.
Precise E2F transcriptional output is regulated by both activation and repression. Interestingly, recent work from our laboratory showed that ablation of the atypical E2F repressor, E2F8, in mice also results in HCC without affecting basic liver functions (45). These observations, together with our current findings, suggest that transcriptional E2F1-3B–mediated activation and E2F8-mediated repression of target genes may be functionally linked. Indeed, we find that many of the E2F1 and E2F3B target genes upregulated in HCC (identified here) are also repressed by E2F8 (45). Thus, it appears that maintenance of normal levels of E2F activity, which require both activators and repressors, is dispensable for animal development and yet is critical for preventing HCC later in life. These findings begin to explain why higher eukaryotes evolved to have such a large and complex family of E2Fs. Evidently, substantial evolutionary currency has been spent to fine-tune E2F output and help promote a cancer-free life span.
Why is the liver particularly sensitive to increased E2F transcriptional output?
Why hepatocytes may be uniquely sensitive to altered levels of E2F target gene expression is a matter of speculation. High levels of cellular proliferation and a toxic cellular environment are 2 key features of developing livers that may explain this cancer susceptibility. Postnatal livers go through a rapid phase of hepatocyte proliferation immediately following birth, which quickly subsides after 3 weeks of age. The liver is also the main site for detoxification, a process that exposes hepatocytes to continuous DNA-damaging insults. ChIP-seq and expression profiling in liver tumors identified a core set of target genes coregulated by E2F1 and E2F3B that are highly enriched for DNA repair or checkpoint activities (Aurka, Ccne1, Cdk1, Cdkn1a, Chek1, Myc, Rad51, and Top2a) and key components of DNA methylation machinery (Hells and Uhrf1). Interestingly, elevated expression of many of these target genes, such as Rad51, is observed in cancer and is associated with decreased survival (46, 47). It is unclear how overexpression of these proteins affects DNA repair and/or other processes involved in maintaining genomic integrity. But one interpretation of these observations is that increased E2F transcriptional output may alter the capacity of hepatocytes to accurately replicate and repair the genome during peak periods of proliferation in a particularly toxic environment.
In addition to increased transcriptional output, an alternative, but not mutually exclusive, theory for the sensitivity of knockin mice to liver cancer may be related to the capacity of hepatocytes to resist a variety of genetic and/or environmental insults that induce programmed cell death. Overexpression of E2F1, either through the artificial introduction of E2F1-overexpressing transgenes or through loss of Rb and/or E2f7-8 repressors, has been shown to engage p53-dependent and -independent apoptotic programs (8, 25, 26, 48, 49). However, we show here that livers of 3a1KI/1KI or 3a3bKI/3bKI mice are particularly resistant to apoptosis despite increased ectopic expression of E2F activators. Thus, we speculate that, relative to other organs in the mouse, the liver is predisposed to HCC development due to the inability of hepatocytes to engage an apoptotic response while remaining fully capable of engaging proliferative gene expression programs.
Hepatocyte-specific ablation of the extra copies of E2f1 (3a1KI) during early development using the Alb-Cre system suggested a cell-autonomous oncogenic role for E2F1 in the initiation of HCC (Figure 5). Whether E2F1 and E2F3 have a role beyond the initiation of HCC remains to be determined. Some insights can be gained from a pilot study using an inducible Cre system (Mx1-Cre) where the oncogenic 3a1KI alleles can be deleted in adult mice after tumor formation (Supplemental Figure 8). In this study, magnetic resonance imaging of established liver tumors in live mice showed that tumor volume continued to increase following the Mx1-Cre–mediated deletion of the 3a1KI knockin alleles, suggesting that extra copies of E2f1 may be dispensable for tumor growth (Supplemental Figure 8). The mechanism of tumor initiation may involve alterations in checkpoint and DNA repair activities specific to the physiology of the liver as discussed above. While not necessary for continued growth, we cannot rule out a role for oncogenic E2F1 in progression to a more malignant phenotype and a poorer outcome.
The genomic landscape of HCC differs from that of most other cancer types since it is void of dominant driving genetic alterations (50). Whole genome analyses of HCC revealed a large number of “heterogeneous” mutations, each contributing a small portion of the entire patient cohort studied. Consistent with this view, we show that not all HCC patients suffer E2F1 and/or E2F3 copy number gains (Figure 1 and Figure 9C), but surprisingly, virtually all tumor samples analyzed exhibit increased expression of E2F1/E2F3B target genes. We propose that dysregulation of the E2F program is sufficient to drive HCC development in mice and is likely a downstream and necessary consequence of most if not all genetic alterations associated with HCC development.
Methods
Supplemental Methods are available online with this article; https://doi.org/10.1172/JCI87583DS1
Mouse care and models.
Mice were housed under normal conditions. E2f1–/–, E2f3a–/–, E2f3b–/–, E2f3a1KI, E2F3a3bKI, Lys-Cre, and Alb-Cre mouse lines were described previously (31, 32, 40, 41). The backgrounds of the E2f1–/–, E2f3a–/–, and E2f3b–/– mice were FVB/NT fifth, fifth, and seventh generations, respectively. The E2f3a1KI and E2F3a3bKI mice were on a mixed background (FVB/NT, 129v/Sv, and C57BL/Swiss). Genotyping was performed on tail or liver DNA using standard PCR techniques. Primer sets used are listed in Supplemental Table 19. Dissected livers were flash-frozen in liquid nitrogen and stored at –80°C for further analysis or fixed in 10% formalin (Fisher Scientific) for histologic analyses. For DEN (Sigma-Aldrich) treatment, mice received an intraperitoneal injection of DEN (20 mg/1 kg body mass) at 20 days of age (33, 51).
Histology and diagnosis of HCC.
Formalin-fixed mouse tissues were processed and stained for H&E using standard protocols. Histopathological analysis was used to determine HCC by pathologists based on cellular morphology (34). Additional analysis was conducted on a subset of samples in which tumor volume, burden, necrosis, and vascular invasion were scored as described in Supplemental Table 1. For immunohistochemistry against Ki-67 (Abcam, 16667) and caspase 3 (Cell Signaling, 9662), slides were stained using a Bond Rx autostainer (Leica) per the manufacturer’s instructions.
Immunoblotting.
Immunoblots were utilized to verify expression of the proteins as described (52). Whole-cell protein lysates were collected at the indicated time points after treatment, separated by SDS-PAGE, and transferred to PVDF membranes. Blots were probed with α-E2F1 (Santa Cruz Biotechnology Inc., C-20), α-E2F3 (Santa Cruz Biotechnology Inc., C-18), α-MYC (Santa Cruz Biotechnology Inc., 9E10), α-tubulin (Santa Cruz Biotechnology Inc., B-7), α-actin (Santa Cruz Biotechnology Inc., I-19), or α-GAPDH (Santa Cruz Biotechnology Inc., FL-335).
Cell culture.
MEFs were isolated from day-13.5 embryos and immortalized using the 3T3 method (53). SNU-449, PLC/PRF5, HepG2, Huh7, and SK-Hep-1 cells were a obtained from Kalpana Ghoshal (The Ohio State University). MEFs, SNU-449, PLC/PRF5, HepG2, Huh7, and SK-Hep-1 cells were cultured in DMEM with 10% FBS. E2Fs were overexpressed in MEFs and HepG2 cells after transduction with the retroviral vector pBABE-Hygro (pBH, Addgene) containing the sequence for murine E2f1, E2f3a, or E2f3b.
ChIP-seq and ChIP-qPCR.
For all ChIPs, proliferating cells were fixed with 1% formaldehyde. Nuclear lysates were sonicated and incubated with 10 μg α-E2F1 (Santa Cruz Biotechnology Inc., c20), α-E2F3 (Santa Cruz Biotechnology Inc., C18), or normal rabbit IgG (Santa Cruz Biotechnology Inc.) overnight. Antibody-protein-DNA complexes were recovered using protein G agarose beads (Millipore), and then decrosslinked.
For ChIP-seq experiments, E2F1, E2F3A, and E2F3B ChIPs were performed in MEFs stably overexpressing the proteins and in 1–/– and 3–/– MEFs. E2F-ChIP-DNA was processed to generate libraries using TruSeq ChIP-DNA library prep kit (Illumina). Briefly, 10 ng of pull-down DNA was used to ligate with barcoded adaptors and amplified with 14 cycles of PCR; then a 200–300–bp library was collected using E-gel (Invitrogen). Library quality was confirmed using High Sensitive DNA Assay (Agilent) and then sequenced by the OSUCCC Genomics Shared Resource with HiSeq 2000 (Illumina).
ChIP-qPCR for endogenous (E2F1 and E2F3) or exogenous (E2F1, E2F3A, and E2F3B) genes was performed in human liver cell lines as previously described (45). Antibodies used were α-E2F1 (Santa Cruz Biotechnology Inc., clone C-20), α-E2F3 (Santa Cruz Biotechnology Inc., clone C-18), MYC (Abcam, clone 9132), or normal rabbit IgG (Santa Cruz Biotechnology Inc.). Primers were designed to amplify regions containing peaks and are listed in Supplemental Table 20.
ChIP-seq data analysis.
E2F1, E2F3A, and E2F3B ChIP-seq reads were mapped against the reference genome (mm9) using Bowtie2 (54). Alignments from each ChIP experiment and input control were processed using MACS1.4 (55) with –t and –c parameters to detect peaks. Peaks from the 1–/– MEFs were subtracted from the E2F1 ChIP, while 3–/– peaks were subtracted from the E2F3A and E2F3B ChIPs. Promoter regions (±2 kb from the TSS) were utilized for downstream analysis. Motif finding was done using the HOMER motif-finding tool (Salk Institute). IPA (QIAGEN) was used for functional analysis of genes. Reads for individual genes were visualized using the Integrative Genomics Viewer (http://software.broadinstitute.org/software/igv/). Gene lists were compared using Venny 2.0.2 (http://bioinfogp.cnb.csic.es/tools/venny/index2.0.2.html)
Cycloheximide treatment.
Populations of MEFs stably overexpressing MYC-tagged E2F3A or E2F3B were synchronized through serum withdrawal and treated with 10 μg/ml of cycloheximide (Sigma-Aldrich). Protein levels were quantified using ImageJ (NIH), and E2F3A and E2F3B intensity values were normalized using tubulin. Half-life was calculated using an online calculator (http://www.calculator.net/half-life-calculator.html)
cDNA microarray.
Normal and tumor total RNA were extracted from the livers of mice at 12 months of age using TRIzol (Invitrogen). RNA (5 μg) was submitted to the OSUCCC Genomics Shared Resource for generation of cDNA and hybridization to Mouse Genome 430 2.0 (MOE4302.0) Affymetrix chips. GeneChip Scanner 3000 (Affymetrix) was used for data acquisition. Data were processed using Expression and Transcriptome Analysis Consoles (Affymetrix). Significantly upregulated probe sets were defined as having a 1.5-fold or greater increase between knockin (3a1KI/1KI or 3a3bKI/3bKI) tumor samples and normal control liver (3a–/–) with P ≤ 0.05 (determined by the software using ANOVA). Human HCC gene expression analysis was performed on a public data set (GSE6764; ref. 44) downloaded from the Gene Expression Omnibus (GEO) and processed using expression and transcriptome analysis consoles. Expression heat maps were generated using R.
Database analysis and data mining.
Analysis of copy number variation mutation rates in human cancer was evaluated using the TCGA liver cancer dataset (LIHC) with the ONCOMINE browser (https://www.oncomine.org/resource/login.html) and the COSMIC database on 07/28/2015. For correlation of copy number and gene expression, patient data from the Liver Hepatocellular Carcinoma (TCGA, provisional) project with putative copy-number alterations from GISTIC and RNA-seq V2 RSEM values were downloaded from cBioPortal (http://www.cbioportal.org/). Kaplan-Meier plots showing HCC patient survival was produced by R package survplot (ref. 56; upregulated expression was defined as a z-score greater than 2). The log-rank test was performed to show significance between different patient groups.
Data deposition.
All original microarray data were deposited in the NCBI’s GEO (GEO GSE71383).
Statistics.
Statistical analyses were performed after consultation with The Ohio State University Center for Biostatistics using JMP (SAS Institute) software. Values were found to be significant at P ≤ 0.05. Individual P values and tests used are described in the figure legends. Briefly, 2-tailed Student’s t tests were used for comparisons between 2 groups. When more than 2 groups were compared, Wilcoxon tests with Bonferroni’s correction for multiple tests were used. Fisher’s exact tests with Bonferroni’s correction for multiple tests were used to analyze categorical data. For gene ontology analysis, Benjamini-Hochberg adjusted P value was calculated by the IPA software. Significance for ChIP-seq and microarray data was calculated by the analysis software as explained above. Significant changes in gene expression between control and diseased human liver samples were determined by Wilcoxon method with Benjamini–Hochberg correction. Wilcoxon rank sum tests were used to test changes in expression of individual genes due to E2F1 or E2F3 copy number changes. To determine whether E2F1/3B targets as a group were increased due to copy number variations, the rank sums of expression values for the targets were calculated for E2F1 or E2F3 copy gained patients and compared with 1,000 sets of randomly sampled genes with the same size. Significance was determined using the tail probability value after comparing these 2 groups. For Kaplan-Meier plots, log-rank tests were used to determine significant changes in patient survival. For box plots, the boxes represent the first and third quartiles and the whiskers represent the highest and lowest values. The center lines are the medians, and outliers are represented with gray dots.
Study approval.
Mouse protocols were approved by the institutional review boards at The Ohio State University. All human data was derived from publicly available data sets therefore no additional consent is needed.
Author contributions
LNK, SB, SYT, and GL designed the experiments. All authors performed the experiments and collected and analyzed data. GL supervised the studies. LNK and GL wrote the manuscript with input from all authors.
Supplementary Material
Acknowledgments
We thank J. Bice and D. Bryant for assistance with histology. We also thank J. McElroy for suggestions on the statistical analysis of data and Kalpana Ghoshal for the liver cell lines. We are thankful to Mike Ostrowski, Denis Guttridge, Lawrence Kirschner, and Christin Burd for critical suggestions. This work was supported by the OSUCCC Genomics Shared Resource and funded by NIH grants (R01CA121275 and CA097189 to GL; R01CA098956 to JMP) as well as a grant from the Dutch Cancer Society (UU 2013-5777 to BW and ADB). LNK and SB were recipients of an NCI T32 in Cancer Genetics. CK was a recipient of an NCI T32 in Mouse Models of Human Disease. CKM was a recipient of a Pelotonia Postdoctoral Fellowship; CK was a recipient of a Pelotonia Graduate Fellowship; GCM, EP, and YH were recipients of Pelotonia Undergraduate Fellowships.
Footnotes
GL’s present address is: The Medical University of South Carolina, Charleston, South Carolina, USA.
Reference information:J Clin Invest. 2017;127(3):830–842.https://doi.org/10.1172/JCI87583.
Contributor Information
Sooin Bae, Email: SooIn.Bae@osumc.edu.
Shih-Yin Tsai, Email: shihyin.tsai@gmail.com.
Xing Tang, Email: tangx1986@gmail.com.
Arunima Srivastava, Email: arunima2@vt.edu.
Christopher Koivisto, Email: christopher.koivisto@osumc.edu.
Elisa Ridolfi, Email: Ridolfi.elisa2@gmail.com.
Emilia Plevris, Email: plevris.2@osu.edu.
Yannis Hadjiyannis, Email: hadjiyannis.1@osu.edu.
Miguel Perez, Email: miguelperez997@hotmail.com.
Eric Nolan, Email: Eric.Nolan@osumc.edu.
Raleigh Kladney, Email: Raleigh.Kladney@osumc.edu.
Bart Westendorp, Email: B.Westendorp@uu.nl.
Alain de Bruin, Email: a.debruin@uu.nl.
Soledad Fernandez, Email: Soledad.Fernandez@osumc.edu.
Gustavo Leone, Email: gustavo.leone@osumc.edu.
References
- 1.Adams MR, Sears R, Nuckolls F, Leone G, Nevins JR. Complex transcriptional regulatory mechanisms control expression of the E2F3 locus. Mol Cell Biol. 2000;20(10):3633–3639. doi: 10.1128/MCB.20.10.3633-3639.2000. [DOI] [PMC free article] [PubMed] [Google Scholar]
- 2.Leone G, et al. Identification of a novel E2F3 product suggests a mechanism for determining specificity of repression by Rb proteins. Mol Cell Biol. 2000;20(10):3626–3632. doi: 10.1128/MCB.20.10.3626-3632.2000. [DOI] [PMC free article] [PubMed] [Google Scholar]
- 3.Di Stefano L, Jensen MR, Helin K. E2F7, a novel E2F featuring DP-independent repression of a subset of E2F-regulated genes. EMBO J. 2003;22(23):6289–6298. doi: 10.1093/emboj/cdg613. [DOI] [PMC free article] [PubMed] [Google Scholar]
- 4.Trikha P, et al. E2f1-3 are critical for myeloid development. J Biol Chem. 2011;286(6):4783–4795. doi: 10.1074/jbc.M110.182733. [DOI] [PMC free article] [PubMed] [Google Scholar]
- 5.Carr SM, Poppy Roworth A, Chan C, La Thangue NB. Post-translational control of transcription factors: methylation ranks highly. FEBS J. 2015;282(23):4450–4465. doi: 10.1111/febs.13524. [DOI] [PubMed] [Google Scholar]
- 6.Frolov MV, et al. Functional antagonism between E2F family members. Genes Dev. 2001;15(16):2146–2160. doi: 10.1101/gad.903901. [DOI] [PMC free article] [PubMed] [Google Scholar]
- 7.Giangrande PH, et al. A role for E2F6 in distinguishing G1/S- and G2/M-specific transcription. Genes Dev. 2004;18(23):2941–2951. doi: 10.1101/gad.1239304. [DOI] [PMC free article] [PubMed] [Google Scholar]
- 8.Li J, et al. Synergistic function of E2F7 and E2F8 is essential for cell survival and embryonic development. Dev Cell. 2008;14(1):62–75. doi: 10.1016/j.devcel.2007.10.017. [DOI] [PMC free article] [PubMed] [Google Scholar]
- 9.Humbert PO, Verona R, Trimarchi JM, Rogers C, Dandapani S, Lees JA. E2f3 is critical for normal cellular proliferation. Genes Dev. 2000;14(6):690–703. [PMC free article] [PubMed] [Google Scholar]
- 10.Wu L, et al. The E2F1-3 transcription factors are essential for cellular proliferation. Nature. 2001;414(6862):457–462. doi: 10.1038/35106593. [DOI] [PubMed] [Google Scholar]
- 11.Timmers C, et al. E2f1, E2f2, and E2f3 control E2F target expression and cellular proliferation via a p53-dependent negative feedback loop. Mol Cell Biol. 2007;27(1):65–78. doi: 10.1128/MCB.02147-05. [DOI] [PMC free article] [PubMed] [Google Scholar]
- 12.Chong JL, et al. E2f1-3 switch from activators in progenitor cells to repressors in differentiating cells. Nature. 2009;462(7275):930–934. doi: 10.1038/nature08677. [DOI] [PMC free article] [PubMed] [Google Scholar]
- 13.Liu H, et al. Redeployment of Myc and E2f1-3 drives Rb-deficient cell cycles. Nat Cell Biol. 2015;17(8):1036–1048. doi: 10.1038/ncb3210. [DOI] [PMC free article] [PubMed] [Google Scholar]
- 14.Duronio RJ, O’Farrell PH, Xie JE, Brook A, Dyson N. The transcription factor E2F is required for S phase during Drosophila embryogenesis. Genes Dev. 1995;9(12):1445–1455. doi: 10.1101/gad.9.12.1445. [DOI] [PubMed] [Google Scholar]
- 15.Ciemerych MA, Sicinski P. Cell cycle in mouse development. Oncogene. 2005;24(17):2877–2898. doi: 10.1038/sj.onc.1208608. [DOI] [PubMed] [Google Scholar]
- 16.Chen HZ, Tsai SY, Leone G. Emerging roles of E2Fs in cancer: an exit from cell cycle control. Nat Rev Cancer. 2009;9(11):785–797. doi: 10.1038/nrc2696. [DOI] [PMC free article] [PubMed] [Google Scholar]
- 17.Knudson AG. Mutation and cancer: statistical study of retinoblastoma. Proc Natl Acad Sci USA. 1971;68(4):820–823. doi: 10.1073/pnas.68.4.820. [DOI] [PMC free article] [PubMed] [Google Scholar]
- 18.Chellappan SP, Hiebert S, Mudryj M, Horowitz JM, Nevins JR. The E2F transcription factor is a cellular target for the RB protein. Cell. 1991;65(6):1053–1061. doi: 10.1016/0092-8674(91)90557-F. [DOI] [PubMed] [Google Scholar]
- 19.Hiebert SW, Chellappan SP, Horowitz JM, Nevins JR. The interaction of RB with E2F coincides with an inhibition of the transcriptional activity of E2F. Genes Dev. 1992;6(2):177–185. doi: 10.1101/gad.6.2.177. [DOI] [PubMed] [Google Scholar]
- 20.Rodriguez-Galindo C, Orbach DB, VanderVeen D. Retinoblastoma. Pediatr Clin North Am. 2015;62(1):201–223. doi: 10.1016/j.pcl.2014.09.014. [DOI] [PubMed] [Google Scholar]
- 21.Azechi H, et al. Disruption of the p16/cyclin D1/retinoblastoma protein pathway in the majority of human hepatocellular carcinomas. Oncology. 2001;60(4):346–354. doi: 10.1159/000058531. [DOI] [PubMed] [Google Scholar]
- 22.Di Fiore R, D’Anneo A, Tesoriere G, Vento R. RB1 in cancer: different mechanisms of RB1 inactivation and alterations of pRb pathway in tumorigenesis. J Cell Physiol. 2013;228(8):1676–1687. doi: 10.1002/jcp.24329. [DOI] [PubMed] [Google Scholar]
- 23.Viatour P, Sage J. Newly identified aspects of tumor suppression by RB. Dis Model Mech. 2011;4(5):581–585. doi: 10.1242/dmm.008060. [DOI] [PMC free article] [PubMed] [Google Scholar]
- 24.Aksoy O, et al. The atypical E2F family member E2F7 couples the p53 and RB pathways during cellular senescence. Genes Dev. 2012;26(14):1546–1557. doi: 10.1101/gad.196238.112. [DOI] [PMC free article] [PubMed] [Google Scholar]
- 25.Wenzel PL, et al. Rb is critical in a mammalian tissue stem cell population. Genes Dev. 2007;21(1):85–97. doi: 10.1101/gad.1485307. [DOI] [PMC free article] [PubMed] [Google Scholar]
- 26.Conner EA, Lemmer ER, Omori M, Wirth PJ, Factor VM, Thorgeirsson SS. Dual functions of E2F-1 in a transgenic mouse model of liver carcinogenesis. Oncogene. 2000;19(44):5054–5062. doi: 10.1038/sj.onc.1203885. [DOI] [PubMed] [Google Scholar]
- 27.Tarangelo A, et al. Recruitment of Pontin/Reptin by E2f1 amplifies E2f transcriptional response during cancer progression. Nat Commun. 2015;6:10028. doi: 10.1038/ncomms10028. [DOI] [PMC free article] [PubMed] [Google Scholar]
- 28.Morris EJ, Dyson NJ. Retinoblastoma protein partners. Adv Cancer Res. 2001;82:1–54. doi: 10.1016/s0065-230x(01)82001-7. [DOI] [PubMed] [Google Scholar]
- 29.Opavsky R, et al. Specific tumor suppressor function for E2F2 in Myc-induced T cell lymphomagenesis. Proc Natl Acad Sci USA. 2007;104(39):15400–15405. doi: 10.1073/pnas.0706307104. [DOI] [PMC free article] [PubMed] [Google Scholar]
- 30.Rempel RE, et al. A role for E2F activities in determining the fate of Myc-induced lymphomagenesis. PLoS Genet. 2009;5(9):e1000640. doi: 10.1371/journal.pgen.1000640. [DOI] [PMC free article] [PubMed] [Google Scholar]
- 31.Field SJ, et al. E2F-1 functions in mice to promote apoptosis and suppress proliferation. Cell. 1996;85(4):549–561. doi: 10.1016/S0092-8674(00)81255-6. [DOI] [PubMed] [Google Scholar]
- 32.Tsai SY, et al. Mouse development with a single E2F activator. Nature. 2008;454(7208):1137–1141. doi: 10.1038/nature07066. [DOI] [PMC free article] [PubMed] [Google Scholar]
- 33.Vesselinovitch SD. Certain aspects of hepatocarcinogenesis in the infant mouse model. Toxicol Pathol. 1987;15(2):221–228. doi: 10.1177/019262338701500216. [DOI] [PubMed] [Google Scholar]
- 34.Thoolen B, et al. Proliferative and nonproliferative lesions of the rat and mouse hepatobiliary system. Toxicol Pathol. 2010;38(7 Suppl):5S–81S. doi: 10.1177/0192623310386499. [DOI] [PubMed] [Google Scholar]
- 35.Jemal A, Bray F, Center MM, Ferlay J, Ward E, Forman D. Global cancer statistics. CA Cancer J Clin. 2011;61(2):69–90. doi: 10.3322/caac.20107. [DOI] [PubMed] [Google Scholar]
- 36.Ferlay J, et al. Cancer incidence and mortality worldwide: sources, methods and major patterns in GLOBOCAN 2012. Int J Cancer. 2015;136(5):E359–E386. doi: 10.1002/ijc.29210. [DOI] [PubMed] [Google Scholar]
- 37.Bosetti C, Turati F, La Vecchia C. Hepatocellular carcinoma epidemiology. Best Pract Res Clin Gastroenterol. 2014;28(5):753–770. doi: 10.1016/j.bpg.2014.08.007. [DOI] [PubMed] [Google Scholar]
- 38.Zhan L, et al. Promising roles of mammalian E2Fs in hepatocellular carcinoma. Cell Signal. 2014;26(5):1075–1081. doi: 10.1016/j.cellsig.2014.01.008. [DOI] [PubMed] [Google Scholar]
- 39.Shirabe K, et al. Role of tumor-associated macrophages in the progression of hepatocellular carcinoma. Surg Today. 2012;42(1):1–7. doi: 10.1007/s00595-011-0058-8. [DOI] [PubMed] [Google Scholar]
- 40.Postic C, Magnuson MA. DNA excision in liver by an albumin-Cre transgene occurs progressively with age. Genesis. 2000;26(2):149–150. doi: 10.1002/(SICI)1526-968X(200002)26:2<149::AID-GENE16>3.0.CO;2-V. [DOI] [PubMed] [Google Scholar]
- 41.Clausen BE, Burkhardt C, Reith W, Renkawitz R, Förster I. Conditional gene targeting in macrophages and granulocytes using LysMcre mice. Transgenic Res. 1999;8(4):265–277. doi: 10.1023/A:1008942828960. [DOI] [PubMed] [Google Scholar]
- 42.Xu X, et al. A comprehensive ChIP-chip analysis of E2F1, E2F4, and E2F6 in normal and tumor cells reveals interchangeable roles of E2F family members. Genome Res. 2007;17(11):1550–1561. doi: 10.1101/gr.6783507. [DOI] [PMC free article] [PubMed] [Google Scholar]
- 43.Ping Z, Lim R, Bashir T, Pagano M, Guardavaccaro D. APC/C (Cdh1) controls the proteasome-mediated degradation of E2F3 during cell cycle exit. Cell Cycle. 2012;11(10):1999–2005. doi: 10.4161/cc.20402. [DOI] [PMC free article] [PubMed] [Google Scholar]
- 44.Wurmbach E, et al. Genome-wide molecular profiles of HCV-induced dysplasia and hepatocellular carcinoma. Hepatology. 2007;45(4):938–947. doi: 10.1002/hep.21622. [DOI] [PubMed] [Google Scholar]
- 45.Kent LN, et al. E2f8 mediates tumor suppression in postnatal liver development. J Clin Invest. 2016;126(8):2955–2969. doi: 10.1172/JCI85506. [DOI] [PMC free article] [PubMed] [Google Scholar]
- 46. doi: 10.18632/oncotarget.10886. Nieto-Jiménez C, et al. DNA-damage related genes and clinical outcome in hormone receptor positive breast cancer. Oncotarget. https://doi.org/10.18632/oncotarget.10886. [DOI] [PMC free article] [PubMed]
- 47.Tennstedt P, et al. RAD51 overexpression is a negative prognostic marker for colorectal adenocarcinoma. Int J Cancer. 2013;132(9):2118–2126. doi: 10.1002/ijc.27907. [DOI] [PubMed] [Google Scholar]
- 48.Ouseph MM, et al. Atypical E2F repressors and activators coordinate placental development. Dev Cell. 2012;22(4):849–862. doi: 10.1016/j.devcel.2012.01.013. [DOI] [PMC free article] [PubMed] [Google Scholar]
- 49.Indovina P, Pentimalli F, Casini N, Vocca I, Giordano A. RB1 dual role in proliferation and apoptosis: cell fate control and implications for cancer therapy. Oncotarget. 2015;6(20):17873–17890. doi: 10.18632/oncotarget.4286. [DOI] [PMC free article] [PubMed] [Google Scholar]
- 50.Schulze K, Nault JC, Villanueva A. Genetic profiling of hepatocellular carcinoma using next-generation sequencing. J Hepatol. 2016;65(5):1031–1042. doi: 10.1016/j.jhep.2016.05.035. [DOI] [PubMed] [Google Scholar]
- 51.Vesselinovitch SD. Infant mouse as a sensitive bioassay system for carcinogenicity of N-nitroso compounds. IARC Sci Publ. 1980;(31):645–655. [PubMed] [Google Scholar]
- 52.Chen HZ, et al. Canonical and atypical E2Fs regulate the mammalian endocycle. Nat Cell Biol. 2012;14(11):1192–1202. doi: 10.1038/ncb2595. [DOI] [PMC free article] [PubMed] [Google Scholar]
- 53.Xu J. Preparation, culture, and immortalization of mouse embryonic fibroblasts. Curr Protoc Mol Biol. 2005;Chapter 28:Unit 28.1. doi: 10.1002/0471142727.mb2801s70. [DOI] [PubMed] [Google Scholar]
- 54.Langmead B, Salzberg SL. Fast gapped-read alignment with Bowtie 2. Nat Methods. 2012;9(4):357–359. doi: 10.1038/nmeth.1923. [DOI] [PMC free article] [PubMed] [Google Scholar]
- 55.Zhang Y, et al. Model-based analysis of ChIP-Seq (MACS) Genome Biol. 2008;9(9):R137. doi: 10.1186/gb-2008-9-9-r137. [DOI] [PMC free article] [PubMed] [Google Scholar]
- 56. Eklund AC. Survplot: Plot survival curves with number-at-risk. R package version 0.0.7. 2012. http://www.cbs.dtu.dk/~eklund/survplot/ Updated April 4, 2012. Accessed December 8, 2016.
Associated Data
This section collects any data citations, data availability statements, or supplementary materials included in this article.


