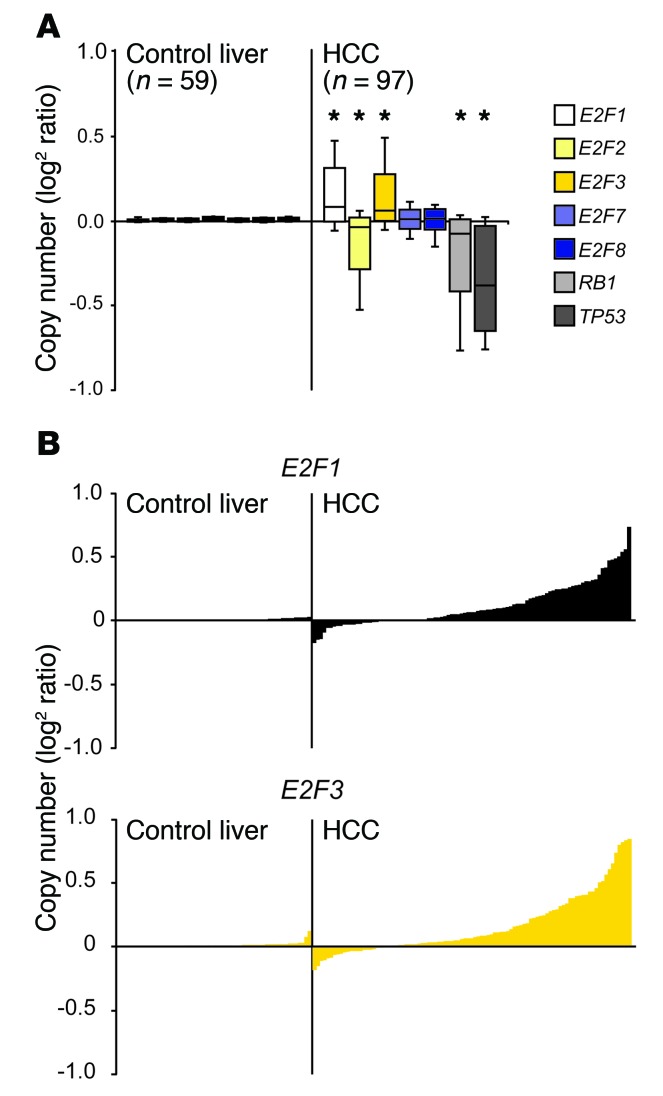
Figure 1. Copy number gains in E2F1 and E2F3 in human primary liver cancer.
(A) Box plots illustrating copy number variations in E2F pathway genes in normal liver and HCC samples using values from the TCGA database. The center lines in boxes represent the median. The boxes represent the first and third quartiles, and the whiskers represent the highest and lowest values. *P < 0.001, 2-sided Student’s t test vs. control liver. (B) An alternate view of the box plots shown in A. Levels of copy number variations are shown on the y axis and individual patients on the x axis.

