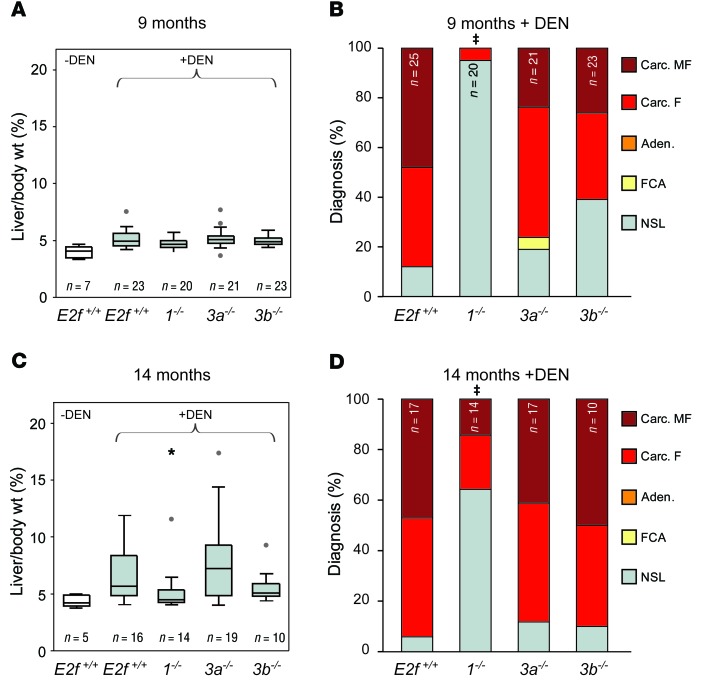
Figure 2. Ablation of E2f1 or E2f3b, but not E2f3a, decreases HCC severity in mice.
(A) Box plots showing the ratio of liver vs. body weight (liver/body wt.) of 9-month-old WT (E2f+/+) and E2f knockout male mice. Non–DEN-treated cohorts are in white, and DEN-treated are shown in gray. The center lines in boxes represent the median. The box represents the first and third quartiles, and the whiskers represent the highest and lowest values. Outliers are represented by gray dots. (B) Histopathological classification of mice from A. Carc. MF, carcinoma multifocal; Carc. F, carcinoma focal; Aden, adenoma; FCA, focal cellular atypia; NSL, no significant lesions. Fisher’s exact tests with Bonferroni’s correction for multiple tests. ‡P ≤ 0.001, carcinoma (focal/multifocal) vs. E2f+/+. (C) Box plots showing liver/body weight of 14-month-old male mice. Non–DEN-treated cohorts are in white, and DEN-treated are shown in gray. *P = 0.040, 1–/– vs. E2f+/+ liver; Wilcoxon method with Bonferroni’s correction. (D) Histopathological classification of mice from C. Fisher’s exact tests with Bonferroni’s correction. ‡P ≤ 0.003, carcinoma vs. E2f+/+.

