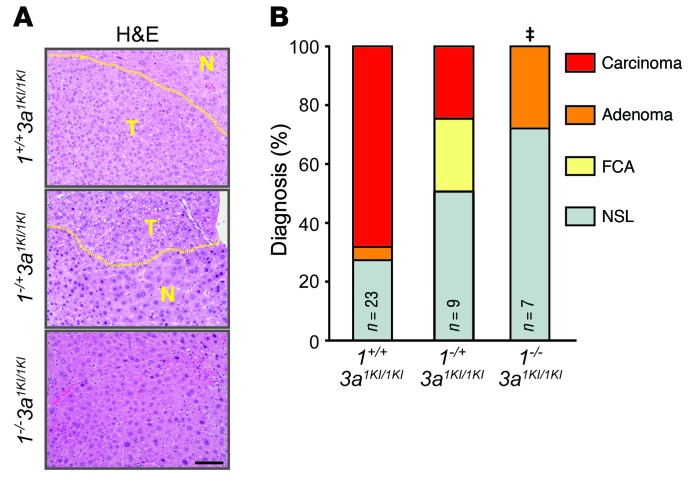
Figure 4. E2f1 gene dosage affects liver cancer in 3a1KI/1KI mice.
(A) Representative photographs of H&E-stained livers from 1+/+3a1KI/1KI, 1–/+3a1KI/1KI, and 1–/–3a1KI/1KI mice at 1 year. Areas of HCC are outlined by dotted lines. Scale bar: 100 μm. (B) Histopathological classification of livers of mice from A. Fisher’s exact tests with Bonferroni’s correction for multiple tests. ‡P = 0.019, carcinoma compared with 1+/+3a1KI/1KI.

