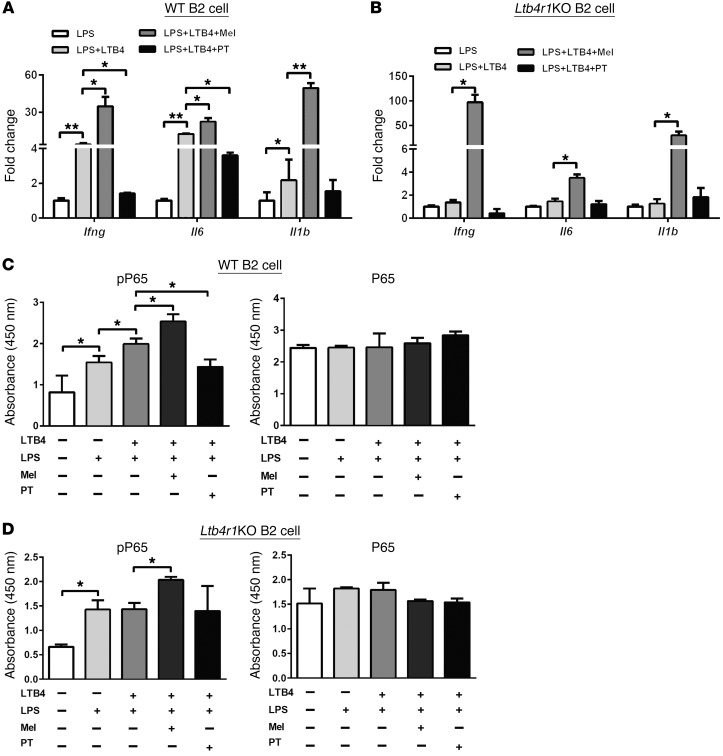
Figure 6. The LTB4/LTB4R1 axis promotes B2 cell activation.
(A and B) The effects of the Gαi agonist Mel or the antagonist PT on the production of proinflammatory cytokines Ifng, Il6, and Il1b during B2 cell activation in the presence of LPS or LTB4. (C and D) The activation of NF-κb in B2 cells in response to LTB4, LPS, Mel, or PT stimulation, as measured by levels of phosphorylated P65. Data are presented as mean ± SEM. n = 6 per group.*P < 0.05; **P < 0.01, 1-way ANOVA with Bonferroni’s post test.

