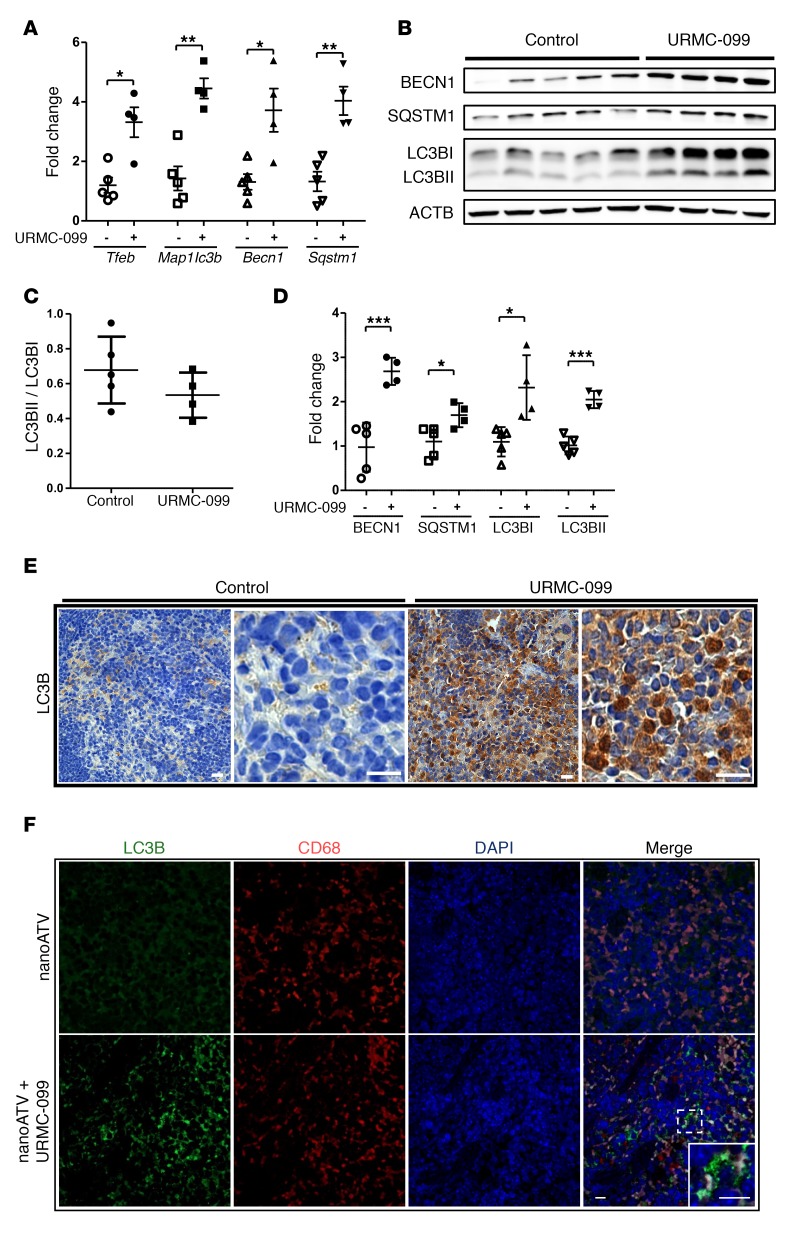
Figure 6. URMC-099 and autophagy in tissues.
Mice were given twice-daily i.p. injections of buffer (control) or URMC-099 (10 mg/kg), and after 21 days, mice were sacrificed and tissues collected. (A) Total RNA was isolated from liver, and real-time qPCR was performed. (B–D) Liver homogenate was analyzed for different autophagy markers using Western blotting (each lane is from 1 mouse) and is presented as (C) the LC3BII/LC3BI ratio and (D) the quantification normalized to ACTB using ImageJ2 software. Paraffin-embedded, 5-μm-thick splenic sections were stained for (E) LC3B, developed with DAB and counterstained with hematoxylin, and for (F) LC3B (green) and mouse CD68 in macrophages (red). DAPI was used to stain nuclei. Values represent the mean ± SEM. *P ≤ 0.05 and **P ≤ 0.01, and ***P ≤ 0.001, by Mann-Whitney U test. Multiple comparisons were assessed for the FDR using the Benjamini-Hochberg method. Five and four mice were included in the control and URMC-099 groups, respectively. Scale bars: 20 μm.

