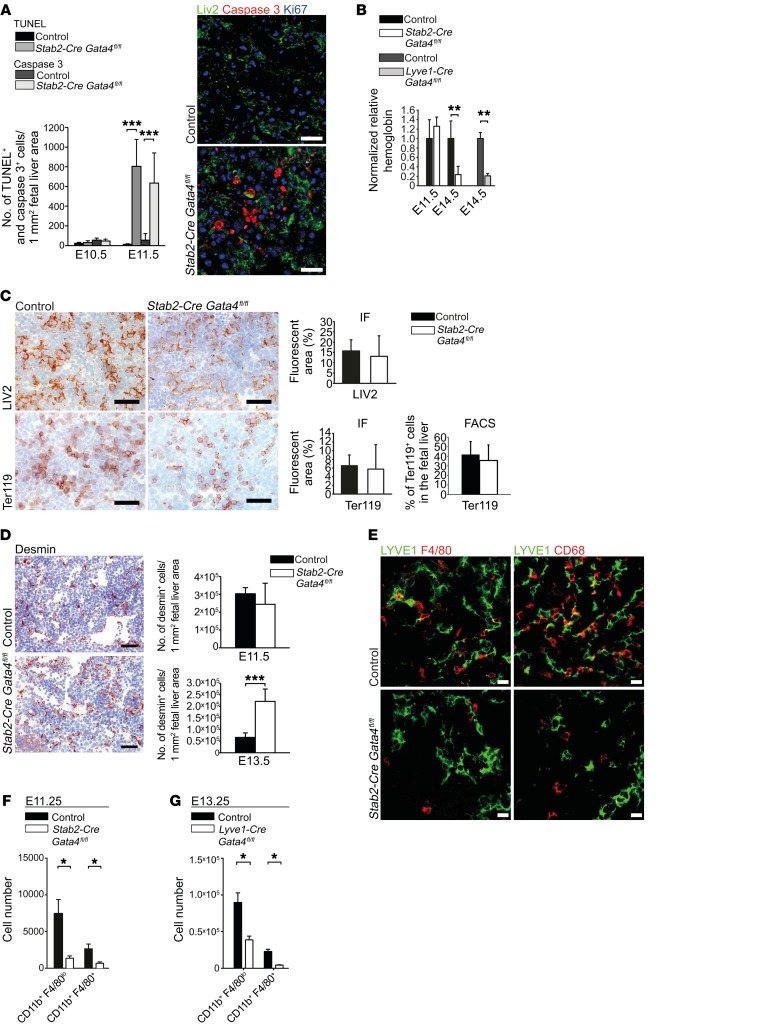
Figure 10. Liver endothelial GATA4 is required for the formation of the fetal hepatic vascular niche.
(A) Quantification of TUNEL assay and IF of cleaved caspase-3 in the fetal liver at E10.5 and E11.5 (n = 3). Co-IF of cleaved caspase-3, Ki67, and LIV2 in the liver of Stab2-Cre Gata4fl/fl embryos (n = 3). Scale bars: 20 μm. (B) Normalized hemoglobin levels from peripheral blood of Stab2-Cre Gata4fl/fl embryos at E11.5 and E14.5 and of Lyve1-Cre Gata4fl/fl embryos at E14.5 (n = 3). (C) Expression of LIV2 and Ter119 in the liver of Stab2-Cre Gata4fl/fl embryos. IHC and quantification based on IF images at E11.5 (n > 3). Scale bars: 50 μm. FACS quantification of Ter119+ cells in relation to total liver cells at E11.25. Data set from Figure 3D. (D) IHC of desmin in the fetal liver of Stab2-Cre Gata4fl/fl embryos at E11.5 (n = 3). Scale bars: 50 μm (left). Quantification based on IF at E11.5 and E13.5 (n = 3). (E) Co-IF of LYVE1, F4/80, and CD68 in the liver of Stab2-Cre Gata4fl/fl embryos at E11.5 (n = 3). Scale bars: 20 μm. (F and G) Quantification upon FACS analysis of CD11b+F4/80lo and CD11b+F4/80+ cells in the liver of Stab2-Cre Gata4fl/fl embryos at E11.25 (F) and in the liver of Lyve1-Cre Gata4fl/fl embryos at E13.25 (G) Stab2-Cre Gata4fl/fl: n = 5 mutants and 6 controls; Lyve1-Cre Gata4fl/fl: n = 6. Student’s t test; *P < 0.05, **P < 0.01,***P < 0.001.

