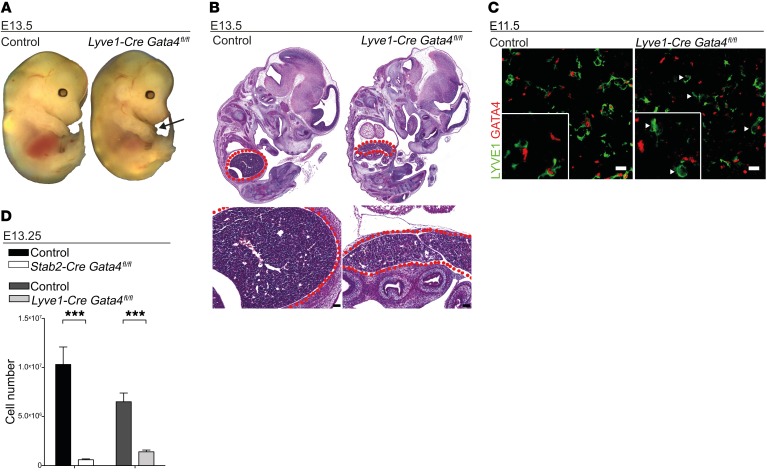
Figure 5. Lyve1-Cre Gata4fl/fl mice show liver hypoplasia and embryonic lethality similar to but less severe than that observed in Stab2-Cre Gata4fl/fl mice.
(A and B) Photomicrographs (A) and H&E staining (B) of Lyve1-Cre Gata4fl/fl embryos at E13.5. Arrow indicates the hypoplastic fetal liver, and red dotted lines indicate the fetal liver (n = 3). Scale bars: 100 μm. (C) Co-IF of GATA4 and LYVE1 of fetal livers of Lyve1-Cre Gata4fl/fl embryos at E11.5. IF shows absence of GATA4 in the mutant liver (arrowheads), but not in controls (n = 3). Scale bars: 10 μm. (D) Total cell numbers of the liver of Stab2-Cre Gata4fl/fl and Lyve1-Cre Gata4fl/fl embryos at E13.25 (Stab2-Cre Gata4fl/fl: n = 13; Lyve1-Cre Gata4fl/fl: n = 6). Student’s t test; ***P < 0.001.

