
Fig. 1.
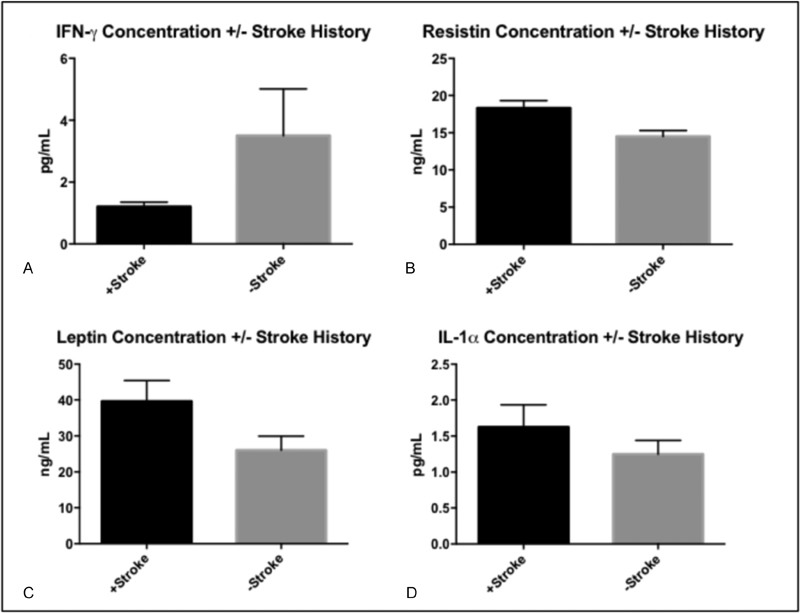
Summary of significant biomarker concentration differences amongst end-stage renal disease (ESRD) patients with history of stroke (+ Stroke) and ESRD patients without history of stroke (- Stroke). Histograms reflect mean values and error bars reflect standard error of the mean. (A) IFN-γ; (B) Resistin; (C) Leptin; (D) IL-1α.