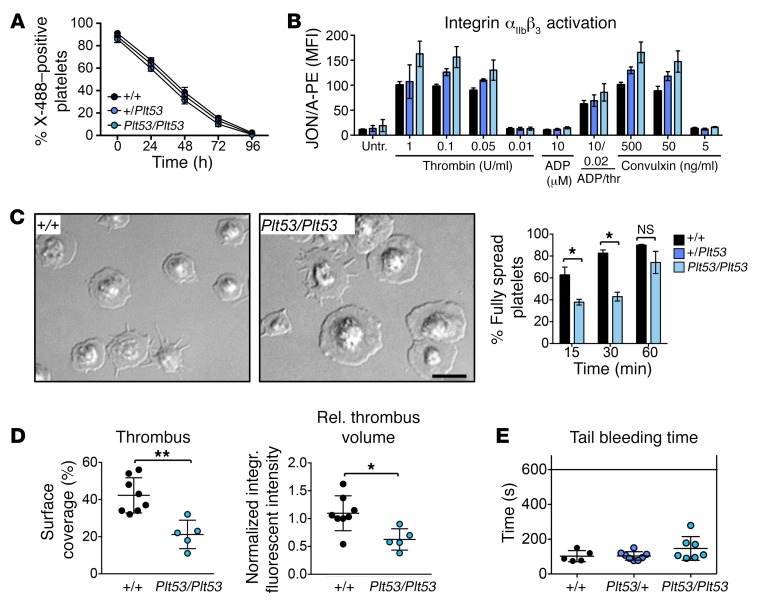
Figure 6. The function of mouse platelets is mildly affected by reduced TPM4 expression.
(A) Normal in vivo lifespan of Tpm4Plt53/+ and Tpm4Plt53/Plt53 compared with Tpm4+/+ platelets. Platelets were labeled by i.v. injection with X-488 antibody (Emfret), and the percentage of fluorescent platelets was monitored over time by flow cytometry (n = 5, representative of 2 independent experiments). (B) Flow cytometric measurement of integrin αIIbβ3 activation (JON/A–PE antibody) in Tpm4+/+, Tpm4Plt53/+, and Tpm4Plt53/Plt53 platelets after activation with the depicted agonists (n = 4, representative of 3 independent experiments). (C) Platelet spreading. Left: Representative differential interference microscopy images of Tpm4+/+ and Tpm4Plt53/Plt53 platelets spread on fibrinogen (100 μg/ml) after activation with 0.01 U/ml thrombin. Scale bar: 5 μm. Right: Percentage of fully spread Tpm4+/+ (black) and Tpm4Plt53/Plt53 (blue) platelets at 15, 30, and 60 minutes after induction of the spreading process (n = 3). Results are representative of 3 independent experiments. (D) Thrombus formation on collagen under flow (shear rate 1,000/s). Left: Mean surface covered with thrombi. Right: Relative platelet deposition, as measured by integrated fluorescent intensity per square millimeter ± SD. Each dot represents an individual. Results are pooled from 2 independent experiments. (E) Tail bleeding times in Tpm4Plt53/+ (blue) and Tpm4Plt53/Plt53 (light blue) compared with Tpm4+/+ (black) mice. Each dot represents an individual. Unpaired 2-tailed Student’s t test, *P < 0.05, **P < 0.01.

