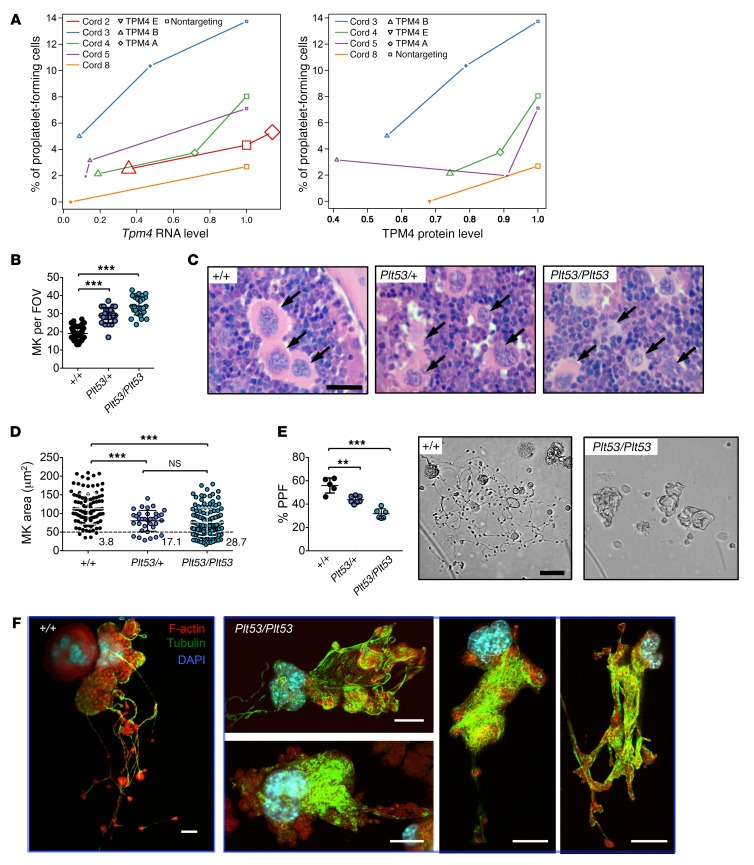
Figure 8. TPM4 dose-dependently facilitates proplatelet formation.
(A) Logistic regression analysis showing that the percentage of proplatelet-forming cells decreases with Tpm4 RNA (left; effect 1.22, P < 2–16) and protein (right; effect 2.54, P = 6.23–12) levels. Node size reflects the number of cells counted (at least 200). (B) Increased number of megakaryocytes (MK) in bone marrow from Tpm4Plt53/+ and Tpm4Plt53/Plt53 mice. Shown are results from 50 fields of view (FOV) (Tpm4+/+ and Tpm4Plt53/+) and 28 FOV (Tpm4Plt53/Plt53). (C) Representative pictures of H&E-stained bone marrow sections show altered morphology (smaller size, irregular shape) of Tpm4Plt53/+ and Tpm4Plt53/Plt53 megakaryocytes compared with the control (n = 3). Arrows indicate megakaryocytes. Scale bar: 15 μm. (D) Decreased size of Tpm4 mutant megakaryocytes compared with WT counterparts. n = 105 (Tpm4+/+), n = 35 (Tpm4Plt53/+), n = 125 (Tpm4Plt53/Plt53). (E) Left: Decreased proplatelet formation (PPF) of fetal liver cell–derived Tpm4Plt53/+ and Tpm4Plt53/Plt53 megakaryocytes (n = 5–6). Each dot represents the mean of 1 individual sample (at least 12 visual fields counted). Right: Representative light microscopy pictures showing altered morphology and decreased branch formation of Tpm4Plt53/+ and Tpm4Plt53/Plt53 compared with Tpm4+/+ megakaryocytes. Scale bar: 50 μm. (F) Investigation of F-actin (red) and tubulin (green) distribution of proplatelet-forming Tpm4+/+ (left) and Tpm4Plt53/Plt53 (right) megakaryocytes by confocal immunofluorescence microscopy. Nuclei were stained with DAPI (blue). Scale bars: 20 μm. (B and E) One-way ANOVA, unpaired 2-tailed Student’s t test with Bonferroni correction for multiple comparisons. (D) One-way ANOVA, Mann-Whitney test with Bonferroni correction for multiple comparisons. **P < 0.01, ***P < 0.001.

