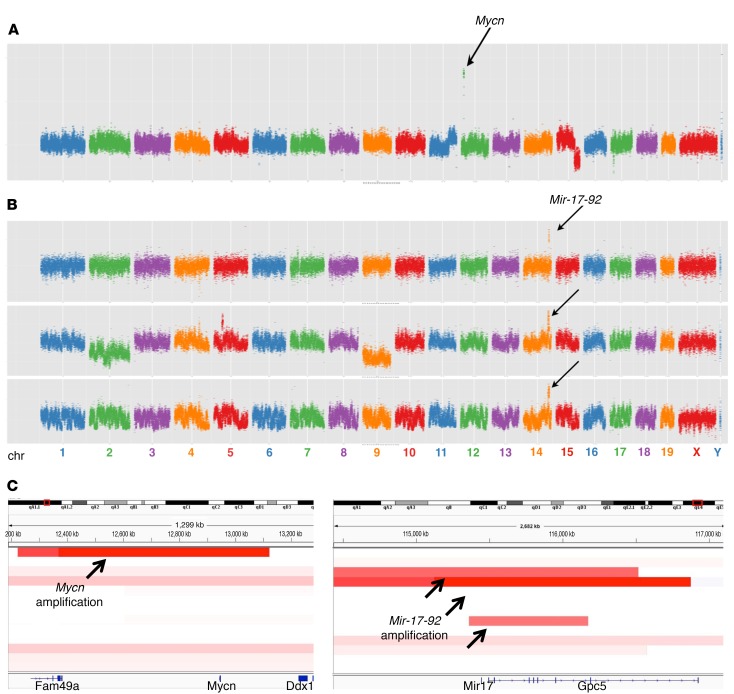
Figure 6. Focal amplifications in Rb/TET-MYCN DOX-independent tumors.
CNV profiles of samples harboring focal amplifications in (A) Mycn or (B) Mir-17-92. Low-coverage whole-genome sequencing data were analyzed using CNVSeq. Arrows point to focal amplifications. chr, chromosome. (C) Integrative Genomics Viewer (IGV) (http://software.broadinstitute.org/software/igv/) plot showing the genomic regions of Mycn and Mir-17-92 amplification.

