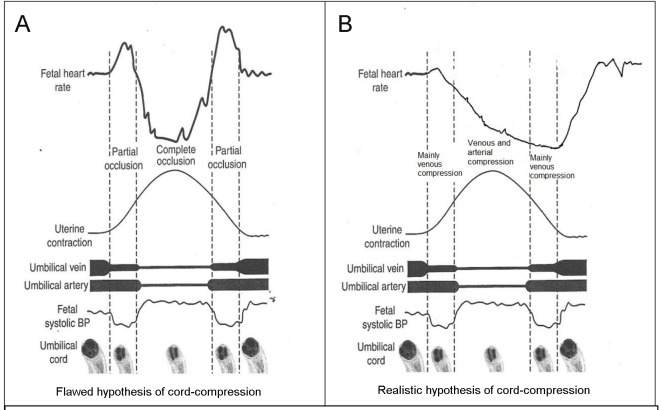
Figure 3.
(A) Popular but flawed hypothesis of cord-compression and variable deceleration [25-27, 31, 32]. CTG speed 3 cm/min. Thankfully reproduced from J Clin Med Res. 2015;7:672-80 [13]. This hypothesis has major fallacies. Complete cord-compression has been postulated for these most common decelerations. FHR recovery commencing at the height of contraction (where umbilical arterial and venous occlusion is unrelieved) cannot be explained. Instead the deceleration depicted seems consistent with “non-hypoxic” vagal reflex (e.g. head-compression). (B) Diagrammatic illustration of how “cord-compression” deceleration would actually look like (CTG speed 3 cm/min). Both baro and chemoreceptor mechanisms come into play as shown by many animal studies [12, 33]. The shape will look more rapid (V shaped) on British CTG (speed 1 cm/min). The nadir is reached well after the peak of contraction and recovery would start when umbilical vein compression (i.e. hypoxemia) is being relieved. This is clearly borne out in the Figure 5, where an example of FHR deceleration with known cord compression is given [12].

