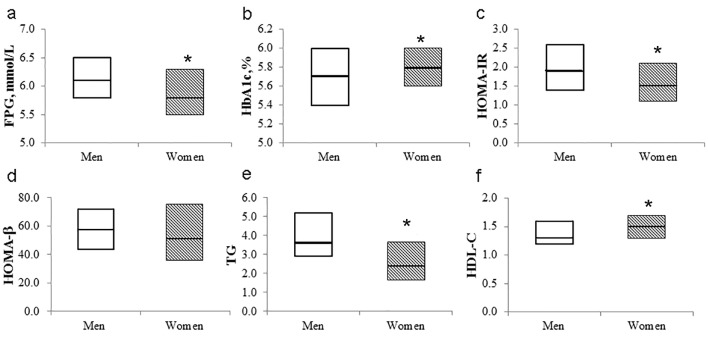
Figure 1.
Box plot of metabolic parameters according to sex. The bold horizontal line represents the median, and the box represents the bounds of the 25th and 75th percentiles. FPG: fasting plasma glucose; HOMA-IR: homeostasis model assessment-insulin resistance; HOMA-β: homeostasis model assessment-beta-cell function; TG: triglycerides; HDL: high-density lipoprotein. *P < 0.05 (vs. men).

