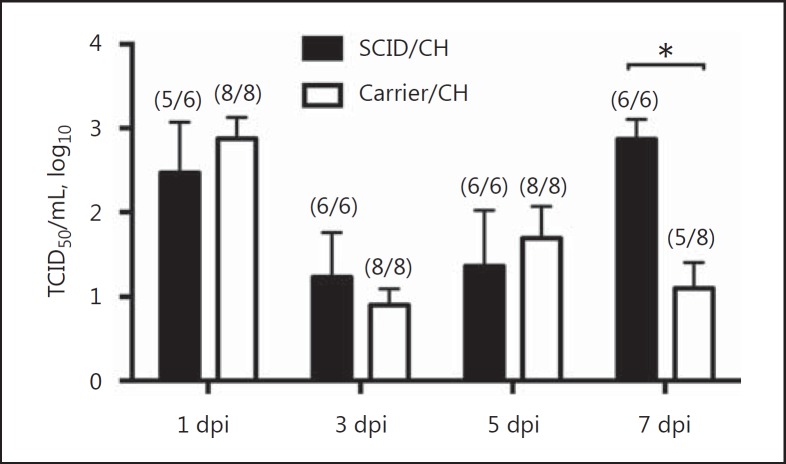
Fig. 2.
Virus titers in nasal swabs at 1, 3, 5, and 7 dpi of pigs with SCID or carrier control pigs challenged (CH) with A/California/04/2009. The numbers of infected pigs/total number of pigs are indicated in parentheses. Results are shown as means and SEM of log10 titers. Significant differences (* p ≤ 0.05) within each dpi are indicated.

