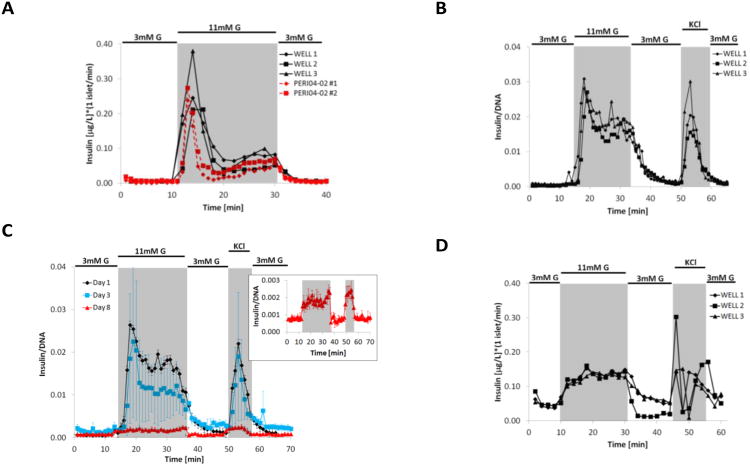
Figure 3.
Experimental results. (A) Comparison of dynamic GSIS performed in the three channels of the present device (FP-3W, solid black lines) and two standard vial chambers of the commercial PERI4-02 machine (dotted red lines) with mouse islets obtained from the same isolation. FP-3W was run at flow rate of 50 μL/min (per channel) with sampling every two minutes, while PERI4-02 vial chamber was run at 100 μL/min with sampling every minute. (B) Dynamics GSIS in mouse islets performed with FP-3W installed on a PERI4-02 platform at University of Florida. FP-3W was run at 100 μL/min (per channel) with sampling every minute. (C) Dynamic GSIS in B6 mice islets performed at day 1 (black line), 3 (blue) and 8 (red) after isolation; FP-3W was installed on a PERI4-02 and flow run at 100 μL/min (per channel) with sampling every minute. Secreted insulin on day 8 was measured with ultrasensitive ELISA (see insert). (D) Dynamic GSIS in human islets performed with FP-3W installed on a PERI4-02 platform; FP-3W was run at 50μL/min (per channel) with sampling every two minutes.

