Abstract
Large amounts of metabolomics data have been accumulated to study metabolic alterations in cancer that allow cancer cells to synthesize molecular materials necessary for cell growth and proliferation. Although metabolic reprogramming in cancer was discovered almost a century ago, the underlying biochemical mechanisms are still unclear. We show that metabolomics data can be used to infer likely biochemical mechanisms associated with cancer. The proposed inference method is data-driven and quite generic; its efficacy is demonstrated with the analysis of changes in purine metabolism of human renal cell carcinoma. The method and results are essentially unbiased and tolerate noise in the data well. The proposed method correctly identified and accurately quantified primary enzymatic alterations in cancer, and these account for over 80% of the metabolic alterations in the investigated carcinoma. Interestingly, the two primary action sites are not the most sensitive reaction steps in purine metabolism, which implies that sensitivity analysis is not a valid approach for identifying cancer targets. The proposed method exhibits statistically high precision and robustness even for analyses of moderately incomplete metabolomics data. By permitting analyses of individual metabolic profiles, the method may become a tool of personalized precision medicine.
Keywords: cancer mechanisms, human renal cell carcinoma, mathematical model, purine metabolism, systems biology
Introduction
Cancer cells frequently alter their metabolism to facilitate rapid growth and proliferation1, 2, a phenomenon that was noticed as early as 1926 by Otto Warburg 3, 4. Particularly affected are aerobic glycolysis, pentose phosphate pathway, Krebs cycle, nucleotide synthesis, and amino acid metabolism, as well as lipid metabolism 2, 5. Some of these changes may be due to oncogenes or tumor suppressor genes, but oncogenesis can also be promoted by the accumulation of metabolites such as succinate, fumarate, and 2-hydroxyglutarate 4, 6-8. While the changed molecular signatures can be considered as one of cancer hallmarks, they can also potentially suggest specific therapeutic targets. However, the most effective targets are seldom metabolites but enzymes that are associated with their dynamics. For example, drugs like 5-fluorouracil, methotrexate, and gemcitabine exert their anti-cancer function through inhibition of metabolic enzymes 9. It is therefore necessary to translate observed changes in molecular signatures into functional changes at the level of enzymes.
Although molecular alterations in cancer have been studied for decades, it is still not clearly understood how metabolic reprogramming is mechanistically achieved. In other words: Which changes in processes are responsible for the metabolic alterations? This important question leads directly to the task of inferring the biochemical mechanisms associated with cancer from metabolomics data. We address this task here, building upon and expanding earlier, preliminary approaches using kinetic models and an inference algorithm 10, 11. Specifically, we focus on biochemical pathways, which we represent with nonlinear systems models, and target biochemical mechanisms underlying metabolic alterations in cancer. The method is implemented as a robust inference algorithm that efficiently explores the huge space of all possible combinations of altered kinetic parameters within the selected pathways and robustly identifies those combinations that are most likely associated with the cancer in question.
The algorithm involves a large number of comparisons of metabolic profiles (simulated vs. observed), which implies a need for intensive computations and metrics for assessing the similarity between profiles. In addition, metabolomics data are typically noisy as well as incomplete, as it is rare that all metabolites in a pathway can be measured. Furthermore, almost all biomedical systems are nonlinear and complex, which renders analytical solutions difficult if not impossible. These challenges have to be taken into consideration by our method.
Experimental
The proposed inference method for biochemical mechanisms associated with cancer contains three components: 1. One or more kinetic models of a metabolic system associated with cancer; 2. Suitable metabolomics data; and 3. An efficient inference algorithm. Our illustration example is purine metabolism in human renal cell carcinoma. This cancer accounts for 2% of all new cancer cases worldwide. In 2015, about 62,000 new cases were diagnosed in the US and about 14,000 individuals died from it 12.
Kinetic model
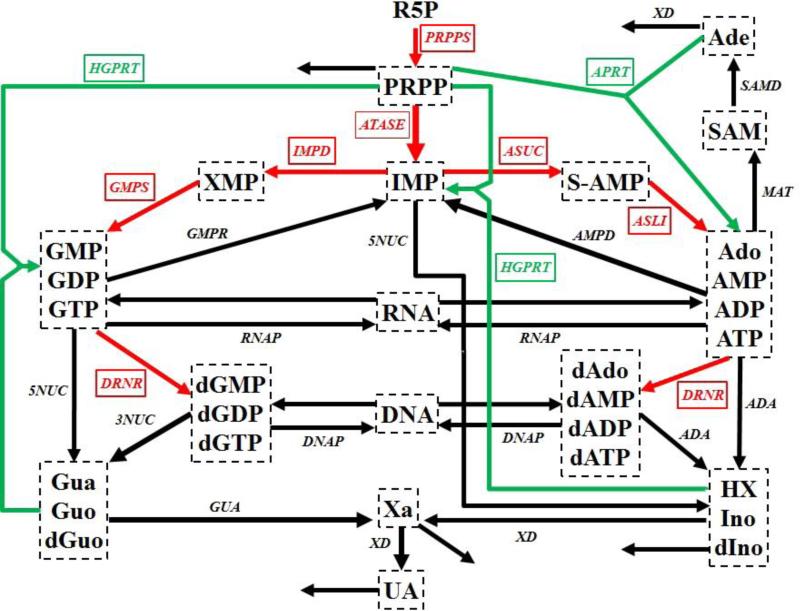
Human renal cell carcinoma is driven by uncontrolled cell growth in a kidney. This growth requires large amounts of nucleotides for DNA and RNA synthesis and points to purine and pyrimidine metabolism as main sources. For our illustration we focus on the former. Purine metabolism is a complex metabolic pathway (Fig. 1) that consists of a de novo synthesis pathway (red arrows) and a salvage pathway (green arrows). As a computational platform we use a detailed kinetic model of human purine metabolism 13, 14 consisting of 16 ordinary differential equations with 37 fluxes. This kinetic model is used as a computational platform and provides the functional connections between changes in proteins/enzymes and metabolic alterations. Further details of the model are described in the Supplements.
Figure 1. Simplified diagram of human purine metabolism.
Purine metabolism consists of a de novo synthesis pathway (red arrows) and a salvage pathway (green arrows) for purine bases. Reactions are represented with arrows. Metabolites are shown in dashed boxes and enzymes are indicated by italics. Table S1 lists enzyme names and their abbreviations. The map was adapted from Curto's work 13, 14, 25. Regulatory signals are omitted for clarity but accounted for in the model. Metabolites and their abbreviations are: phosphoribosylpyrophosphate (PRPP), inosine monophosphate (IMP), adenylosuccinate (S-AMP), adenosine + adenosine monophosphate + adenosine diphosphate + adenosine triphosphate (Ado_AMP_ADP_ATP), S-adenosyl-L-methionine (SAM), adenine (Ade), xanthosine monophosphate (XMP), guanosine monophosphate + guanosine diphosphate + guanosine triphosphate (GMP_GDP_GTP), deoxyadenosine + deoxyadenosine monophosphate + deoxyadenosine diphosphate + deoxyadenosine triphosphate (dAdo_dAMP_dADP_dATP), deoxyguanosine monophosphate + deoxyguanosine diphosphate + deoxyguanosine triphosphate (dGMP_dGDP_dGTP), ribonucleic acid (RNA), deoxyribonucleic acid (DNA), hypoxanthine + inosine + deoxyinosine (HX_Ino_dIno), xanthine (Xa), guanine + guanosine + deoxyguanosine (Gua_Guo_dGuo), uric acid (UA), ribose-5-phosphate (R5P).
Metabolomics data
Weber discovered several changes in the enzyme activities of purine metabolism in human renal carcinoma cells 15. The affected enzymes (and their fold changes compared to normal kidney cells; in parentheses) are: amidophosphoribosyltransferase (ATASE, 1.58), IMP dehydrogenase (IMPD, 2.53), adenylosuccinate synthetase (ASUC, 1.49), adenylosuccinate lyase (ASLI, 1.76), AMP deaminase (AMPD, 2.07), xanthine oxidase or xanthine dehydrogenase (XD, 0.25).
Unfortunately, the corresponding metabolite levels were not measured in these samples. Thus, we created an artificial “dataset” by implementing the measured enzymatic changes in the dynamic purine model and thereby obtaining the resulting metabolic alterations at the steady state of the model. These alterations are considered our “data” (Table 1). They consist of concentrations [μM] of 16 metabolites in normal and cancer cells, from which differences between these two types of cells were computed. In this demonstration, the “data” are artificially generated, which permits precise analyses and interpretations of results, whereas they would consist of actual experimental or clinical findings in a true analysis.
Table 1.
Metabolic profiles in normal human cells and human renal cell carcinoma%
| Metabolite^ | Normal Cell (μM) | Cancer Cell (μM) | Absolute Change (μM) | Relative Change (%) |
|---|---|---|---|---|
| PRPP | 5.017 | 4.698 | −0.320 | −6.376 |
| IMP | 98.264 | 82.785 | −15.479 | −15.752 |
| S_AMP | 0.198 | 0.156 | −0.043 | −21.484 |
| Ado/AMP/ADP/ATP | 2475.379 | 2177.100 | −298.309 | −12.051 |
| SAM | 3.992 | 3.887 | −0.105 | −2.618 |
| Ade | 0.985 | 0.878 | −0.107 | −10.851 |
| XMP | 24.793 | 925.311 | 900.518 | 3632.172 |
| GMP/GDP/GTP | 410.234 | 633.248 | 223.014 | 54.363 |
| dAdo/dAMP/dADP/dATP | 6.017 | 6.305 | 0.288 | 4.777 |
| dGMP/dGDP/dGTP | 3.026 | 3.293 | 0.267 | 8.816 |
| RNA | 28680.584 | 30152.000 | 1471.000 | 5.129 |
| DNA | 5180.797 | 5432.700 | 251.925 | 4.863 |
| HX/Ino/dIno | 9.519 | 9.579 | 0.061 | 0.639 |
| Xa | 5.06 | 34.879 | 29.819 | 589.310 |
| Gua/Guo/dGuo | 5.507 | 33.198 | 27.691 | 502.818 |
| UA | 100.296 | 86.599 | −13.697 | −13.656 |
In reality, metabolomics data are noisy and incomplete. In order to evaluate the efficacy and accuracy of our method, we first analyze this ideal metabolomics (i.e., noise-free and complete) dataset, and later assess the tolerance of our method to incomplete and noisy data.
Inference algorithm
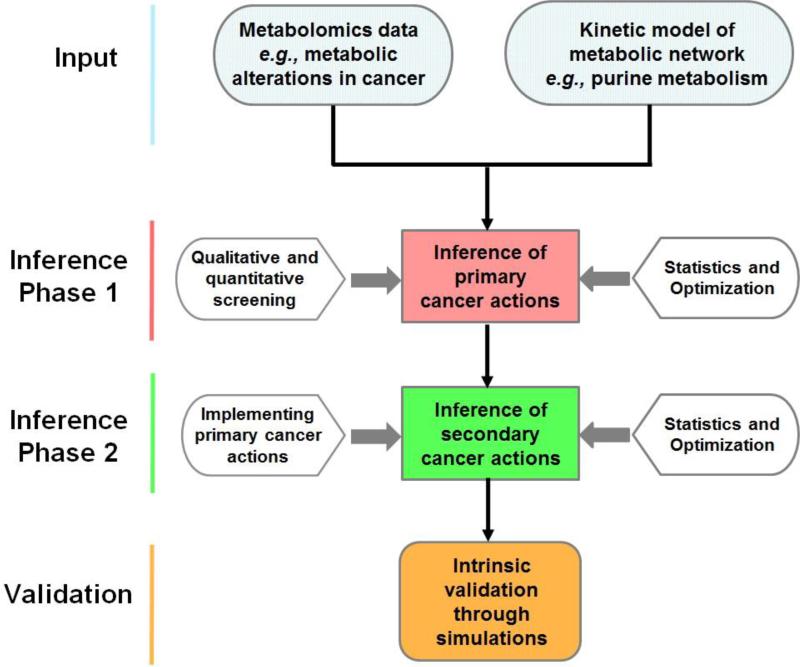
Using the metabolomics data as input and the kinetic model of purine metabolism as a computational platform, the proposed algorithm employs a multi-step strategy to screen out kinetic parameters that are probably not affected by cancer and to home in on the most likely alterations (Diagram 1). The core idea is to identify combinations of changes in enzyme activities that result in metabolic profiles most similar to those observed in the metabolomics data. However, instead of targeting the one singly best solution, the method is designed to identify large feasible ensembles of solutions and thereby to obtain statistically robust conclusions. This goal is achieved with millions of Monte Carlo simulations and an optimization process for filtering (Fig. 2).
Diagram 1. Flowchart describing the proposed algorithm.
The input consists of two components, namely, suitable metabolomics data and a mathematical model of the system under consideration. Phase 1 of the algorithm is dedicated to inferring primary disease actions in the system; it uses different screening techniques, as well as optimization and statistical evaluation of the screening results. In Phase 2, the alterations inferred in Phase 1 are implemented in the model, and further screening and statistical assessments yield information regarding secondary disease actions. An intrinsic validation of the results is possible through simulations, while an extrinsic validation would require additional data that had not been used in the screening process.
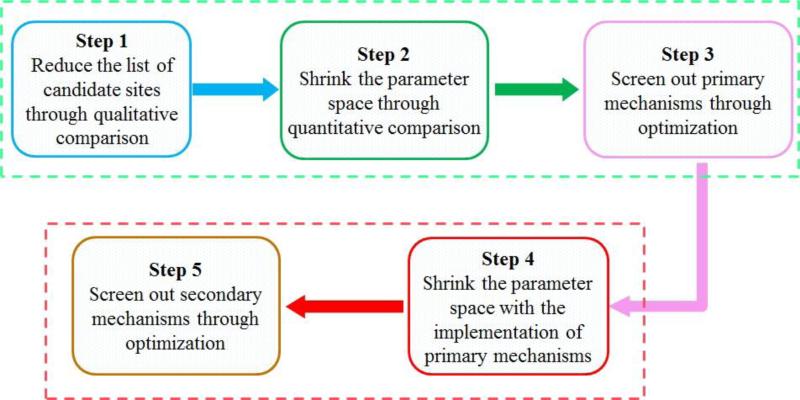
Figure 2. Flow chat of the proposed algorithm for the inference of biochemical mechanisms from metabolomics data.
The algorithm is composed of two phases and five steps. The first three steps belong to Phase 1, while Phase 2 is composed of the remaining two steps (the 4th and 5th steps). Each step is discussed in the text. The first phase is designed to discover the primary actions of a disease, while the second phase targets secondary actions.
As one component, the filtering process requires the objective comparison of metabolic profiles. Each profile is represented as a vector, and the similarity between two vectors is assessed with their Euclidean distance. If a simulated vector is close enough to the observed profile, with a smaller Euclidean distance than a predefined threshold, it is kept; otherwise it is discarded. All vectors surviving this filtering will have their corresponding changes in enzyme activities been stored as admissible sets of perturbations. These admissible sets are collectively analyzed to obtain statistically robust conclusions. The details of the two-phase, multi-step inference algorithm are described in the Supplement.
Results
The proposed two-phase, multi-step method discovers primary and secondary mechanisms separately. Accordingly, we divide the results of inferred mechanisms into two parts.
Phase 1 - Step 1
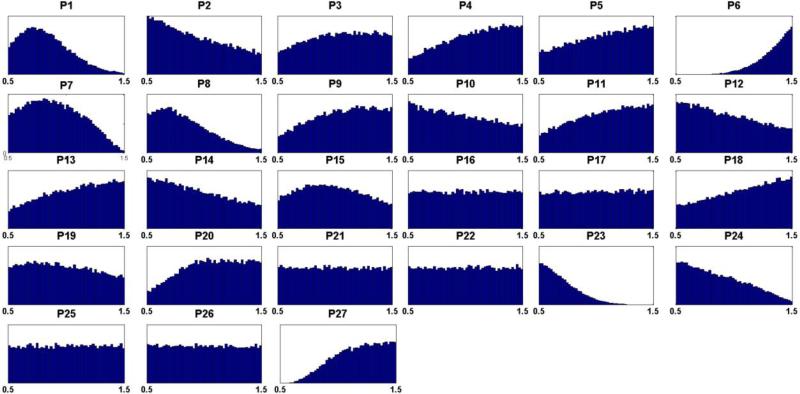
Out of five million Monte Carlo simulations, we only retain those combinations of enzyme alterations that cause the same direction of changes in metabolites (increased (+); decreased (−)) between tumor and normal cells as the metabolomics data (Table 1). Although coarse, this qualitative filtering results in an enormous reduction (> 99%) from all simulated combinations to an admissible subpopulation of about 30,000 sets. From this admissible subpopulation, we generate a distribution of disease actions at each candidate site (Fig. 3) and compute its skewness coefficients. Candidate sites with essentially symmetric distributions (uniform, Gaussian, etc.), as judged by the predefined threshold of 0.4 for the skewness coefficient, are excluded from further consideration. Specifically, a high index (close to 0.5) suggests that there is not likely an imposed biological constraint on the parameter (i.e., on a relevant enzyme) in question and that cancer is therefore not likely to affect this enzyme. Table S1 shows the list of all 27 candidate target sites.
Figure 3. Distributions of hypothesized cancer actions from admissible sets for each candidate site.
Hypothesized cancer actions are identified by causing the same sign of change (either increased (+) or decreased (−)) in metabolites between normal cells and tumor represented by metabolomics data. Out of five million Monte Carlo simulations, a very small subpopulation (31,497 sets) remained after filtering according to the first, qualitative criterion and was retained in the form of admissible sets. X-axes are fold changes at each candidate site with respect to their nominal levels. The list (P1 – P27) is composed of: phosphoribosylpyrophosphate synthetase (P1), amidophosphoribosyltransferase (P2), hypoxanthine-guanine phosphoribosyltransferase (P3), adenine phosphoribosyltransferase (P4), ‘pyrimidine synthesis’ (P5), inosine monophosphate dehydrogenase (P6), guanosine monophosphate synthetase (P7), adenylosuccinate synthetase (P8), adenylosuccinate lyase (P9), guanosine monophosphate reductase (P10), adenosine monophosphate deaminase (P11), methionine adenosyltransferase (P12), protein O-methyltransferase (P13), s-adenosylmethionine decarboxylase (P14), 5'-Nucleotidase (P15), 5'(3') Nucleotidase (P16), diribonucleotide reductase (P17), adenosine deaminase (P18), RNA polymerase (P19), RNases (P20), DNA polymerase (P21), DNases (P22), xanthine oxidase/xanthine dehydrogenase (P23), guanine hydrolase (P24), ‘hypoxanthine excretion’ (P25), ‘xanthine excretion’ (P26), ‘uric acid excretion’ (P27).
The 17 sites remaining as candidates after this step of filtering are: phosphoribosylpyrophosphate synthetase (P1), amidophosphoribosyltransferase (P2), adenine phosphoribosyltransferase (P4), pyrimidine synthesis (P5), inosine monophosphate dehydrogenase (P6), guanosine monophosphate synthetase (P7), adenylosuccinate synthetase (P8), adenylosuccinate lyase (P9), adenosine monophosphate deaminase (P11), methionine adenosyltransferase (P12), protein O-methyltransferase (P13), s-adenosylmethionine decarboxylase (P14), adenosine deaminase (P18), RNases (P20), xanthine oxidase/xanthine dehydrogenase (P23), guanine hydrolase (P24), ‘uric acid excretion’ (P27). These 17 candidate sites were kept for the consideration in the next step, while the other 10 sites were henceforth excluded.
Phase 1 - Step 2
For the second step, we randomly sample one million sets of enzyme combinations involving only the remaining 17 sites. For each set, we compare the simulated and observed metabolic profiles and compute the Euclidean norm between them. The one million sets are sorted according to their norms in ascending order. The top one thousand sets are selected; their corresponding metabolic differences have a mean Euclidean distance of 634.0 (±94.5), which is enormously improved over the corresponding value of 10,111 (±20,205) for the entire one million sets of random alterations. This step shrinks the space of possible combinations of alterations based on quantitative information.
Phase 1 - Step 3
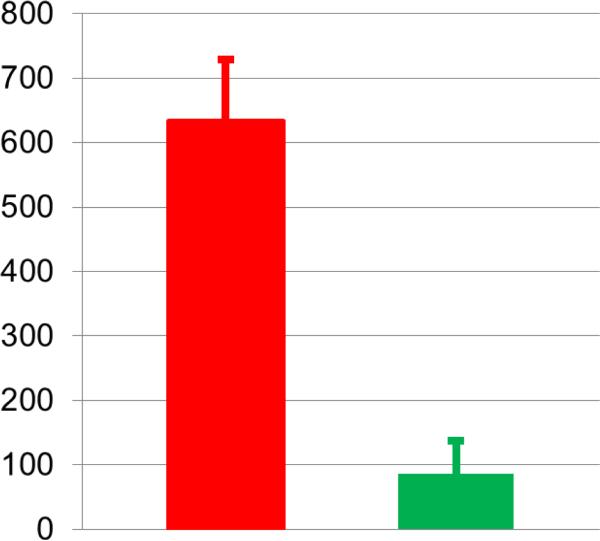
A genetic algorithm optimization is run with the selected top one thousand combinations of hypothesized enzyme alterations from the second step as the initial values. Among the optimized sets, we choose the best subset (833 sets) with differences of 85.8±51.9 (Fig.4), which is much smaller than the best set from the second step. The skewness coefficient for each candidate site is shown in Table 2.
Figure 4. Differences between simulated metabolic profiles and observed metabolomics data.
The red bar shows the differences between simulated metabolic profiles and the observed metabolomics data. Only the top one thousand sets of hypothesized actions were selected from the 2nd step, which results in a mean difference of 634.0 (±94.5). The green bar represents a mean difference of 85.8 (±51.9) from the selected 833 sets of hypothesized actions after an optimization procedure in the 3rd step, which yields a significant improvement.
Table 2.
Skewness indices of distributions of hypothesized cancer actions
| Enzyme or reaction | Abbreviation | EC | Index of skewness% |
|---|---|---|---|
| phosphoribosylpyrophosphate synthetase | PRPPS | 2.7.6.1 | 0.484 |
| amidophosphoribosyltransferase | ATASE | 2.4.2.14 | 0.264 |
| adenine phosphoribosyltransferase | APRT | 2.4.2.7 | 0.347 |
| ‘pyrimidine synthesis’ | PYRS | # | 0.322 |
| inosine monophosphate dehydrogenase | IMPD | 1.1.1.205 | 0.000$ |
| guanosine monophosphate synthetase | GMPS | 6.3.5.2 | 0.344 |
| adenylosuccinate synthetase | ASUC | 6.3.4.4 | 0.376 |
| adenylosuccinate lyase | ASLI | 4.3.2.2 | 0.278 |
| adenosine monophosphate deaminase | AMPD | 3.5.4.6 | 0.254 |
| methionine adenosyltransferase | MAT | 2.5.1.6 | 0.319 |
| protein O-methyltransferase | MT | 2.1.1.77, 2.1.1.80, and 2.1.1.100 | 0.247 |
| s-adenosylmethionine decarboxylase | SAMD | 4.1.1.50 | 0.252 |
| adenosine deaminase | ADA | 3.5.4.4 | 0.308 |
| RNases | RNAN | # | 0.142 |
| xanthine oxidase/xanthine dehydrogenase | XD | 1.17.1.4 and 1.17.3.2 | 0.002$ |
| guanine hydrolase | GUA | 3.5.4.3 | 0.428 |
The index reflects the degree of asymmetry between the activating section and the inhibitory section of the distribution of a parameter (see Supplements).
Multiple enzymes.
Significance: index of skewness < 0.05.
The results statistically and clearly suggest that two enzymes emerge as most likely primary targets in human renal cell carcinoma, namely: inosine monophosphate dehydrogenase (IMPD) and xanthine oxidase/xanthine dehydrogenase (XD). The intensities of changes in these enzymes, expressed as median fold changes in cancer with respect to their nominal values in normal tissue, were inferred as: 2.439 (activation at IMPD) and 0.236 (inhibition at XD). From Weber's work, we know the exact enzymatic changes in human renal cell carcinoma and, indeed, the predicted sites are among the six cancer targets identified by the enzymological study. The predictions of intensities of these two alterations are surprisingly accurate: 2.439 vs. 2.53 (prediction vs. IMPD data); 0.236 vs. 0.25 (prediction vs. XD data).
Validity of predicted primary cancer sites
Although these two cancer sites are correctly identified, validation is needed to affirm that they are primary mechanisms of human renal cell carcinoma. Among all possible combinations of six enzymatic alterations that were experimentally measured by Weber, it could theoretically be possible that a different combination could contribute more significantly to the cancer metabolic profile. To test this possibility, and quasi as a computational validation of our results, we implemented, one at a time, all possible combinations of the six known cancer-associated enzyme alterations in the model of purine metabolism. These simulations accounted for alterations of only one enzyme up to alterations in all six enzymes simultaneously.
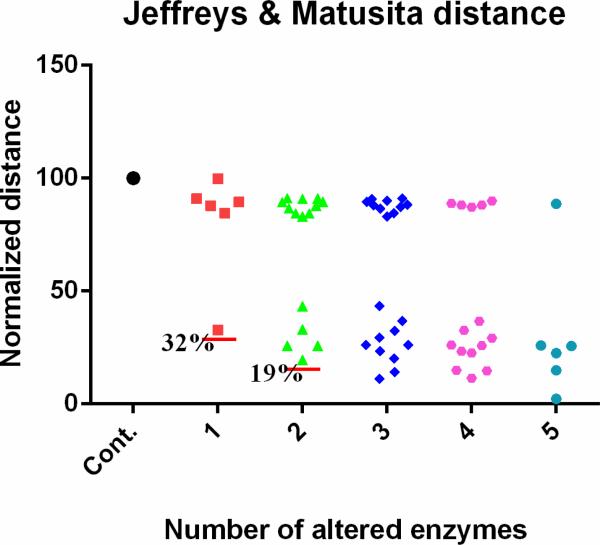
For each combination, the computed and observed metabolic profiles were compared and the computed distance was normalized and assessed. If only one out of the six enzymatic alterations is implemented, there are six choices, which are put into one group. Similarly, we construct scenarios of two-enzyme alterations (15 different combinations of exact perturbations), three-enzyme alterations (20 different combinations), four-enzyme alterations (15 different combinations), and five-enzyme alterations (6 different combinations). Figure 5 shows the Jeffreys & Matusita metrics for these scenarios (other metrics show similar results, data not shown; but see Qi et al. 2016)16. The left-most symbol is the control, which corresponds to the distance between the healthy and cancer profiles and by definition has a normalized distance of 100. The next set of symbols (red) corresponds to a single alteration, the following set (green) corresponds to two simultaneous alterations, and so forth. As shown, the activation at IMPD accounts for 68% of the metabolic alterations found in human renal cell carcinoma. The combination of activating IMPD and inhibiting XD explains 81% of the alterations. Therefore, the predicted alterations at IMPD and XD are computationally confirmed as primary cancer actions.
Figure 5. Contributions of different enzymes to the observed metabolic alterations.
Out of six known enzymatic changes, different combinations are implemented. When only one enzyme activity is altered, there are six different choices and the corresponding results are put into the column next to the control, which corresponds to a healthy system. Subsequent columns show the results of two (15 different combinations), three (20 different combinations), four (15 different combinations), and five combinatory alterations (6 different combinations). The y-axis represents Jeffreys & Matusita distances, which are normalized to the distance between the true health and disease profiles (see Supplements). Each red horizontal line shows the smallest distance in the corresponding column.
Phase 2 - Steps 4 and 5
81% of the observed metabolic alterations are already explained by the two primary alterations (IMPD and XD). These two are implemented in the model, which subsequently allows an assessment of secondary mechanisms of human renal cell carcinoma. This assessment is achieved with steps 4 and 5 of our algorithm (Table S2).
The algorithm predicted three secondary mechanisms: inhibition of adenylosuccinate synthetase (ASUC), activation of amidophosphoribosyltransferase (ATASE), and inhibition of uric acid excretion (VUA). Compared to actually observed enzymatic changes in human renal cell carcinoma from the enzymological study 15, two cancer targets (ASUC and ATASE) are correctly identified and the action mode at the site ATASE is correctly predicted. However, the algorithm suggests an inhibition of ASUC instead of the observed activation. The algorithm furthermore missed two secondary mechanisms: activation of adenylosuccinate lyase (ASLI) and adenosine monophosphate deaminase (AMPD). In addition, uric acid excretion (VUA) is wrongly predicted as a step associated with cancer. Thus, these secondary inferences are by far not as strong as the primary inferences.
Incomplete metabolomics data
We used for our analysis a constructed, ideal metabolomics dataset, which is complete and noise free. In reality, experimental and clinical measurements are noisy and typically incomplete. Since our results showed that only the primary cancer actions can be reliably and robustly discovered even if the metabolomics data are ideal, it is useful to assess the robustness of our method for the inference of primary cancer actions when the metabolomics data are incomplete. In the metabolomics data for the sixteen metabolites in purine metabolism, nine metabolites show more than 10% relative change from normal cells to human renal cell carcinoma. Suppose that experiments only monitor four out of these nine metabolites and that the selection of these four measurements is random. If so, there are 126 possible combinations for random selections of four metabolites out of nine. For each of these, we used our method to infer primary cancer alterations. Table S3 shows statistical measures of robustness of our method for the inference of primary cancer actions when the metabolomics data are incomplete.
The results indicate that our method has a precision (or positive predictive value) as high as 92%. However, it performs rather poorly in terms of sensitivity (or true positive rate), which is 19.2%, when randomly incomplete metabolomics data are used. Here, precision is defined as the quotient between true positive and (true positive + false positive), while sensitivity is the quotient between true positive and (true positive + false negative). These statistical measures (high precision and low sensitivity) indicate that our method may exhibit low sensitivity when the metabolomics data have low metabolite coverage; in other words, it may not be able to predict primary cancer associated alterations in this case. Nonetheless, the strength of the method is its high precision, which gives us high confidence that any prediction of primary actions is true. Not surprisingly, further tests showed that the sensitivity can be greatly improved when the metabolite coverage of data is increased (data not shown).
Conclusions and Discussion
High-throughput methods and instruments have greatly accelerated the accumulation of – omics data. Among these, metabolomics data are intriguing because they form the bridge between enzymes, which govern biochemical mechanisms, with metabolites, which are directly tied to physiological function. This connection is important because the specific mechanisms of a disease or physiological perturbation are often unclear. The scientific community realizes the importance of metabolomics data and is investing considerable funding, e.g., in the effort of the Common Fund Metabolomics Program at NIH (http://commonfund.nih.gov/metabolomics/index). While the amount of metabolomics data is growing quickly, their analysis lags behind and poses challenges.
Many diseases result in metabolic alterations. A good example is cancer, leading to metabolic reprogramming, which may be attributed to the activation of oncogenes, inhibition of tumor suppressor genes, or changes in metabolic enzymes, such as RAS, BRAF, p53, PTEN, succinate dehydrogenase, and fumarate hydratase 17-21. Traditionally, experimentalists have been assessing the role of each potential contributor individually, thereby generating new and relevant hypotheses. This reductionistic approach has achieved great success and generated rich data and knowledge about cancer.
As a complementary approach, we propose here a systemic way of analyzing metabolomics data with the aim of obtaining new insights into biochemical mechanisms that are altered in cancer. The rationale is that metabolic alterations in cancer are to be attributed to enzymatic changes and that the connection between underlying mechanisms and the observed metabolic alterations can therefore be computationally and systematically inferred. As we demonstrated here, primary alterations in cancer, which account for over 80% of changes in metabolic profiles, can be correctly and accurately identified and quantified if the data are of sufficiently high quality. Interestingly, the two identified primary enzymatic sites for purine metabolism in human renal cell carcinoma are not the most sensitive components of purine metabolism, which suggests that sensitivity analysis is not a valid approach toward the inference of cancer targets. Some enzymes may have very high sensitivities, but that does not mean that they are altered or varied as much as some of the less sensitive enzymes. Nonetheless, our study shows that the mechanistic information that underlies changes in metabolic profiles is stored in the kinetic features of the metabolic pathway and can therefore be extracted by our proposed method.
One challenge is that there is no a priori knowledge regarding how many enzymes are targeted, what the mode of each cancer alteration is, and how strong each alteration is. Therefore, our method needs to treat each candidate site equally and must quantify possible cancer-associated alterations at each action sites in the pathway system. While this complexity may seem overwhelming, our method correctly inferred two primary alterations in human renal cell carcinoma and even predicted the intensities of change with surprising accuracy: 2.439 vs. 2.53 for the change in IMPD (prediction vs. enzymological data) and 0.236 vs. 0.25 for the change in XD (prediction vs. enzymological data). These primary alterations account for over 80% of the observed metabolic alterations.
Our method did not correctly identify all secondary cancer mechanisms, which account for less than 20% of the observed metabolic alterations, even though the method suggested some of them. Further analyses showed that synergisms and antagonisms among these candidates compensate for each other and thereby obscure the connections between biochemical mechanisms and metabolic alterations. Therefore, additional data or information may be needed for the correct interpretation of secondary disease actions.
By design, the proposed method intrinsically tolerates noise in the data. In addition, it exhibits high precision and robustness of inferring primary cancer alterations from incomplete metabolomics data. Although all candidate sites of cancer action are treated equally and without bias, the new method does not only correctly infer primary target sites but also accurately quantifies cancer-associated alterations with statistical confidence. Without depending on a priori knowledge about number, location, mode, and intensity of cancer alterations, the method is entirely data driven and therefore rather generic and unbiased.
Previously, flux balance analysis was used to quantify the relationships between gene expression and metabolite levels in yeast 22 and between gene expression and kinetic rate constants in human plasma and erythrocytes 23. In a different approach, Diener and colleagues used k-cone analysis to quantify enzyme regulation in HeLa cells from the intracellular metabolome 24. This strategy assumes that the metabolic network is at a steady state and uses stoichiometric models to characterize the relationship between fluxes, which are represented by mass action laws. Compared to our method, Diener's method requires less computation, but its limitation is that it assumes steady-state operation in both normal and cancer cells and that it is governed by mass action functions, which are difficult to expand to allow for regulation. Our method uses more realistic kinetic models as computational platforms and can be applied to analyze dynamic features of cancer. In our case study here, we do focus on steady-state operation, but a steady state is not required in our method. In addition, our method is quite tolerant toward incomplete metabolomics data and does not require the imputation of unmeasured metabolites, which is necessary in Diener's method. While our study uses a complex kinetic model of purine metabolism to demonstrate the power of the proposed method, the generic applicability of the proposed method easily permits other kinetic models such as mass action law models.
In the current implementation of the proposed method, all metabolites are equal and have the same weight in the comparison of metabolic profiles. However, metabolites can differently contribute to cancer initiation, progression, or metastasis, as, for instance, the significant association of succinate and fumarate with some types of cancer. Therefore, future work should incorporate such information into new versions of our method and permit different weights of different metabolites.
Even without these extensions, the proposed method may become a valuable tool for personalized precision medicine.
Supplementary Material
Acknowledgements
This work was supported by a grant from the National Institutes of Health (P01-ES016731, GWM, PI), an endowment from the Georgia Research Alliance (EOV, PI), and a Pilot and Feasibility award (ZQ, PI) from the NIH Regional Comprehensive Metabolomics Resource Core grant 1U24DK097215-01A1 (RMH, PI). Any opinions, findings, conclusions or recommendations expressed in this material are those of the authors and do not necessarily reflect the views of the sponsoring institutions.
Footnotes
Author Contributions
Z.Q. and E.O.V. designed research; Z.Q. performed research and analyzed results; Z.Q. and E.O.V. wrote the paper. All authors critically reviewed content and approved the final version for publication.
Conflict of Interest
The authors have no conflict of interest to declare.
References
- 1.Wu W, Zhao S. Acta biochimica et biophysica Sinica. 2013;45:18–26. doi: 10.1093/abbs/gms104. [DOI] [PubMed] [Google Scholar]
- 2.Schulze A, Harris AL. Nature. 2012;491:364–373. doi: 10.1038/nature11706. [DOI] [PubMed] [Google Scholar]
- 3.Warburg O, Wind F, Negelein E. The Journal of general physiology. 1927;8:519–530. doi: 10.1085/jgp.8.6.519. [DOI] [PMC free article] [PubMed] [Google Scholar]
- 4.Levine AJ, Puzio-Kuter AM. Science. 2010;330:1340–1344. doi: 10.1126/science.1193494. [DOI] [PubMed] [Google Scholar]
- 5.Vander Heiden MG, Cantley LC, Thompson CB. Science. 2009;324:1029–1033. doi: 10.1126/science.1160809. [DOI] [PMC free article] [PubMed] [Google Scholar]
- 6.Isaacs JS, Jung YJ, Mole DR, Lee S, Torres-Cabala C, Chung YL, Merino M, Trepel J, Zbar B, Toro J, Ratcliffe PJ, Linehan WM, Neckers L. Cancer cell. 2005;8:143–153. doi: 10.1016/j.ccr.2005.06.017. [DOI] [PubMed] [Google Scholar]
- 7.Selak MA, Armour SM, MacKenzie ED, Boulahbel H, Watson DG, Mansfield KD, Pan Y, Simon MC, Thompson CB, Gottlieb E. Cancer cell. 2005;7:77–85. doi: 10.1016/j.ccr.2004.11.022. [DOI] [PubMed] [Google Scholar]
- 8.Dang L, White DW, Gross S, Bennett BD, Bittinger MA, Driggers EM, Fantin VR, Jang HG, Jin S, Keenan MC, Marks KM, Prins RM, Ward PS, Yen KE, Liau LM, Rabinowitz JD, Cantley LC, Thompson CB, Vander Heiden MG, Su SM. Nature. 2009;462:739–744. doi: 10.1038/nature08617. [DOI] [PMC free article] [PubMed] [Google Scholar]
- 9.Chabner BA, Roberts TG., Jr. Nature reviews. Cancer. 2005;5:65–72. doi: 10.1038/nrc1529. [DOI] [PubMed] [Google Scholar]
- 10.Qi Z, Voit EO. Transl Cancer Res. 2014;3:233–242. doi: 10.3978/j.issn.2218-676X.2014.05.03. [DOI] [PMC free article] [PubMed] [Google Scholar]
- 11.Qi Z, Miller GW, Voit EO. Toxicology. 2014;315:92–101. doi: 10.1016/j.tox.2013.11.003. [DOI] [PMC free article] [PubMed] [Google Scholar]
- 12.Siegel RL, Miller KD, Jemal A. CA: a cancer journal for clinicians. 2015;65:5–29. doi: 10.3322/caac.21254. [DOI] [PubMed] [Google Scholar]
- 13.Curto R, Voit EO, Sorribas A, Cascante M. Mathematical biosciences. 1998;151:1–49. doi: 10.1016/s0025-5564(98)10001-9. [DOI] [PubMed] [Google Scholar]
- 14.Curto R, Voit EO, Cascante M. 329. The Biochemical journal. 1998;(Pt 3):477–487. doi: 10.1042/bj3290477. [DOI] [PMC free article] [PubMed] [Google Scholar]
- 15.Weber G. Clinical biochemistry. 1983;16:57–63. doi: 10.1016/s0009-9120(83)94432-6. [DOI] [PubMed] [Google Scholar]
- 16.Matusita K. Ann Math Stat. 1955;26:631–640. [Google Scholar]
- 17.Ying H, Kimmelman AC, Lyssiotis CA, Hua S, Chu GC, Fletcher-Sananikone E, Locasale JW, Son J, Zhang H, Coloff JL, Yan H, Wang W, Chen S, Viale A, Zheng H, Paik JH, Lim C, Guimaraes AR, Martin ES, Chang J, Hezel AF, Perry SR, Hu J, Gan B, Xiao Y, Asara JM, Weissleder R, Wang YA, Chin L, Cantley LC, DePinho RA. Cell. 2012;149:656–670. doi: 10.1016/j.cell.2012.01.058. [DOI] [PMC free article] [PubMed] [Google Scholar]
- 18.Yun J, Rago C, Cheong I, Pagliarini R, Angenendt P, Rajagopalan H, Schmidt K, Willson JK, Markowitz S, Zhou S, Diaz LA, Jr., Velculescu VE, Lengauer C, Kinzler KW, Vogelstein B, Papadopoulos N. Science. 2009;325:1555–1559. doi: 10.1126/science.1174229. [DOI] [PMC free article] [PubMed] [Google Scholar]
- 19.Song MS, Salmena L, Pandolfi PP. Nature reviews. Molecular cell biology. 2012;13:283–296. doi: 10.1038/nrm3330. [DOI] [PubMed] [Google Scholar]
- 20.Vousden KH, Ryan KM. Nature reviews. Cancer. 2009;9:691–700. doi: 10.1038/nrc2715. [DOI] [PubMed] [Google Scholar]
- 21.Gottlieb E, Tomlinson IP. Nature reviews. Cancer. 2005;5:857–866. doi: 10.1038/nrc1737. [DOI] [PubMed] [Google Scholar]
- 22.Zelezniak A, Sheridan S, Patil KR. PLoS computational biology. 2014;10:e1003572. doi: 10.1371/journal.pcbi.1003572. [DOI] [PMC free article] [PubMed] [Google Scholar]
- 23.Bordbar A, McCloskey D, Zielinski DC, Sonnenschein N, Jamshidi N, Palsson BO. Cell systems. 2015;1:283–292. doi: 10.1016/j.cels.2015.10.003. [DOI] [PubMed] [Google Scholar]
- 24.Diener C, Munoz-Gonzalez F, Encarnacion S, Resendis-Antonio O. Scientific reports. 2016;6:28415. doi: 10.1038/srep28415. [DOI] [PMC free article] [PubMed] [Google Scholar]
- 25.Curto R, Voit EO, Sorribas A, Cascante M. The Biochemical journal. 1997;324(Pt 3):761–775. doi: 10.1042/bj3240761. [DOI] [PMC free article] [PubMed] [Google Scholar]
Associated Data
This section collects any data citations, data availability statements, or supplementary materials included in this article.


