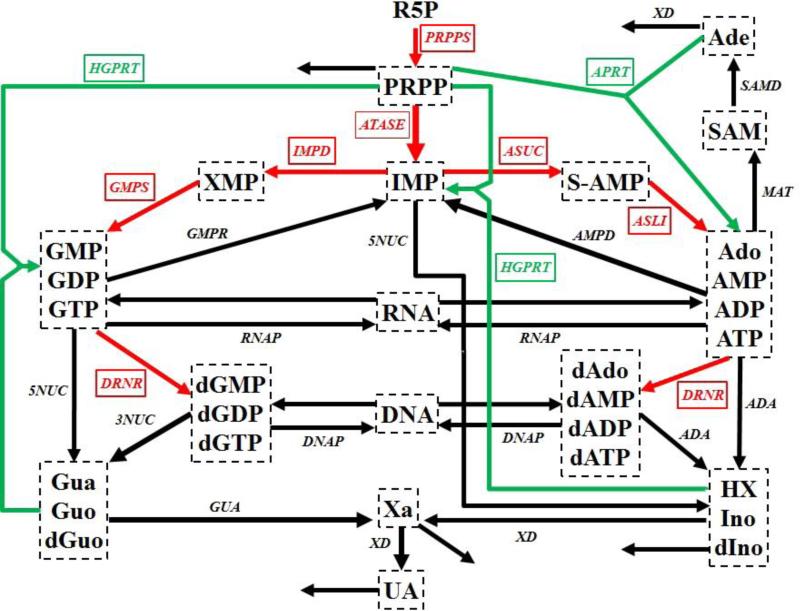
Figure 1. Simplified diagram of human purine metabolism.
Purine metabolism consists of a de novo synthesis pathway (red arrows) and a salvage pathway (green arrows) for purine bases. Reactions are represented with arrows. Metabolites are shown in dashed boxes and enzymes are indicated by italics. Table S1 lists enzyme names and their abbreviations. The map was adapted from Curto's work 13, 14, 25. Regulatory signals are omitted for clarity but accounted for in the model. Metabolites and their abbreviations are: phosphoribosylpyrophosphate (PRPP), inosine monophosphate (IMP), adenylosuccinate (S-AMP), adenosine + adenosine monophosphate + adenosine diphosphate + adenosine triphosphate (Ado_AMP_ADP_ATP), S-adenosyl-L-methionine (SAM), adenine (Ade), xanthosine monophosphate (XMP), guanosine monophosphate + guanosine diphosphate + guanosine triphosphate (GMP_GDP_GTP), deoxyadenosine + deoxyadenosine monophosphate + deoxyadenosine diphosphate + deoxyadenosine triphosphate (dAdo_dAMP_dADP_dATP), deoxyguanosine monophosphate + deoxyguanosine diphosphate + deoxyguanosine triphosphate (dGMP_dGDP_dGTP), ribonucleic acid (RNA), deoxyribonucleic acid (DNA), hypoxanthine + inosine + deoxyinosine (HX_Ino_dIno), xanthine (Xa), guanine + guanosine + deoxyguanosine (Gua_Guo_dGuo), uric acid (UA), ribose-5-phosphate (R5P).

